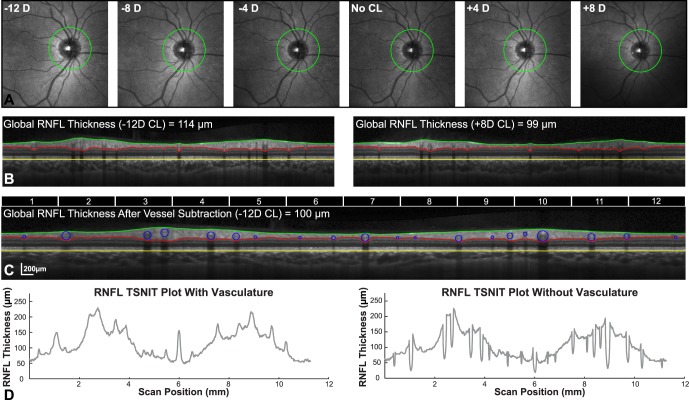
Figure 2. .
(A) 30-degree IR-SLO fundus images with RNFL scan path illustrate an increase in retinal region scanned with increase in contact lens power. (B) The OCT B-scans acquired with a −12 D and +8 D contact lens demonstrate the change in RNFL thickness associated with scan path. (C) Retinal vasculature was subtracted from the RNFL thickness after scans were rescaled to a 1:1 aspect ratio. Top portion of the figure illustrates the 30-degree sectors used for data analysis. The 12 sectors illustrated are those used, 30-degree sectors used for data analysis are illustrated in (D). Resulting TSNIT plots with and without vasculature were used to compute average thickness and area measures.

