Figure 3. .
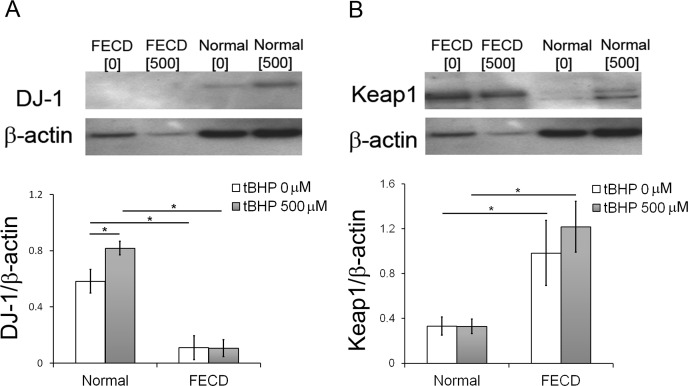
Response of DJ-1 and Keap1 to oxidative stress. (A) Representative bands of Western blot analysis of DJ-1 levels in FECD CECs and normal control after incubation in 0 or 500 μM of tBHP. Averaged densitometric analysis showed an increase in DJ-1 level in response to oxidative stress in normal corneal endothelium but not in FECD. β-Actin was used for normalization of protein loading. (B) Representative bands of Western blot analysis of Keap1 levels in FECD CECs and normal control after incubation in 0 or 500 μM of tBHP. Averaged densitometric analysis detected increase in Keap1 levels in FECD as compared with normal CECs. β-Actin was used for normalization of protein loading. Data are represented as mean ± SEM. *P < 0.05.

