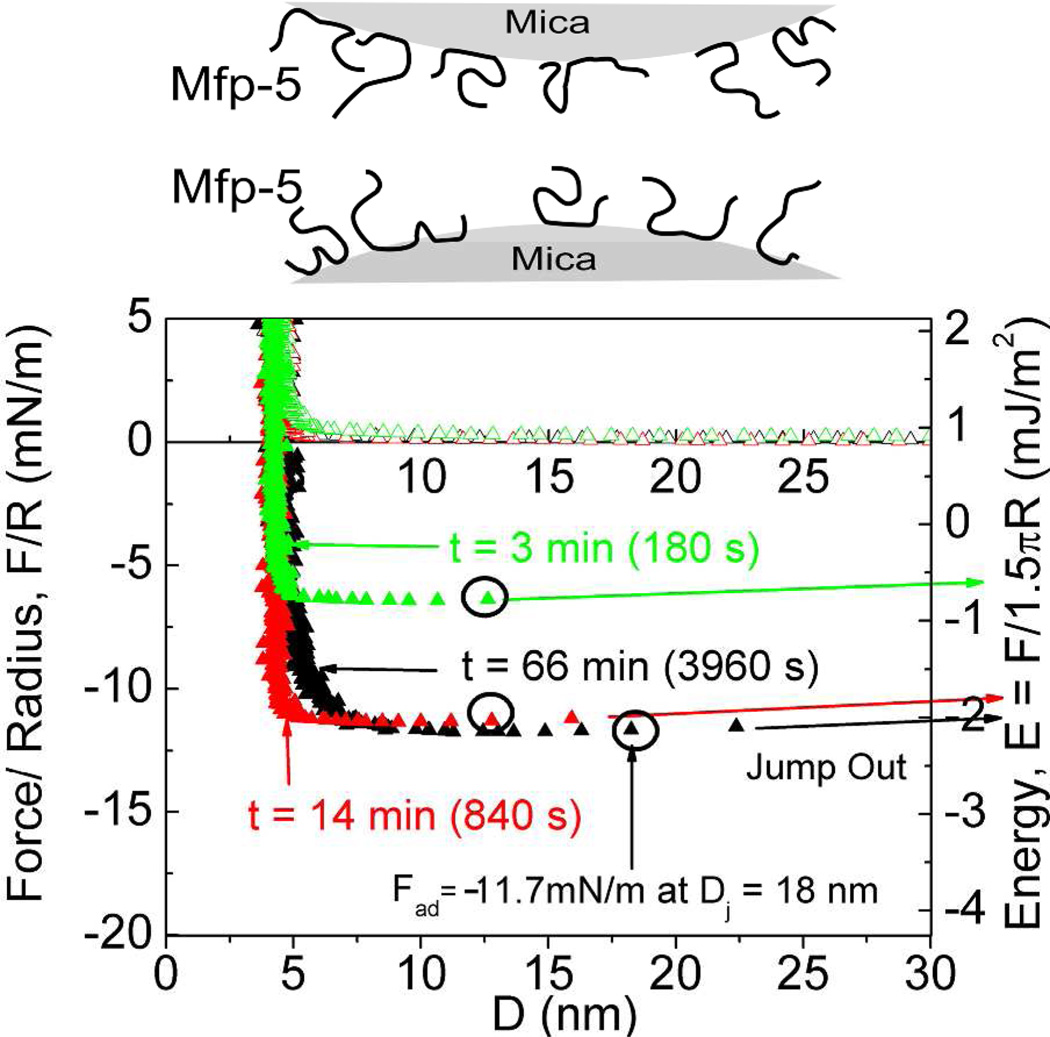
Figure 3.
Mefp-5/Mefp-5 symmetric configuration with 20 µl of 60µg/ml protein deposited on both surfaces (schematic above graph) with 3× higher protein concentration during deposition than in other experiments. The total contact times are denoted with (t). Circled points indicate Fad of the run. Solution I=100 mM, pH 2.6.

