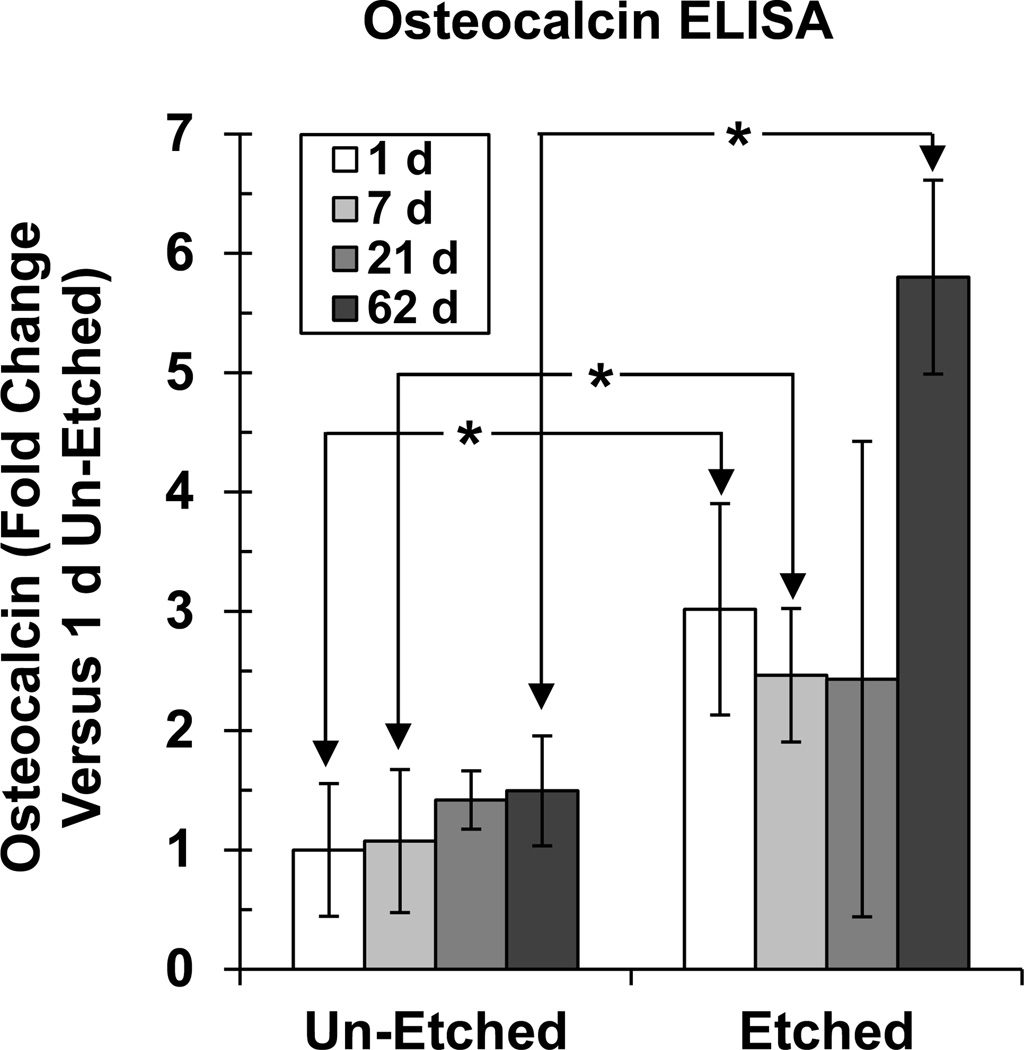
Figure 5.
Etched scaffolds induced hBMSC osteocalcin expression. At various time points, the matrix that formed on the scaffolds was assayed for osteocalcin protein using ELISA. Error bars are S.D. (n = 4). Asterisks indicate significant differences between un-etched and etched scaffolds for 1 d, 7 d and 62 d (t-test, P < 0.05). Osteocalcin did not change significantly over time for un-etched [one-way analysis of variance (ANOVA) with Tukey’s test, P > 0.05]. Osteocalcin changed significantly over time for etched scaffolds and 62 d was significantly higher than 1 d, 7 d and 21 d (ANOVA with Tukey’s test, P < 0.05).

