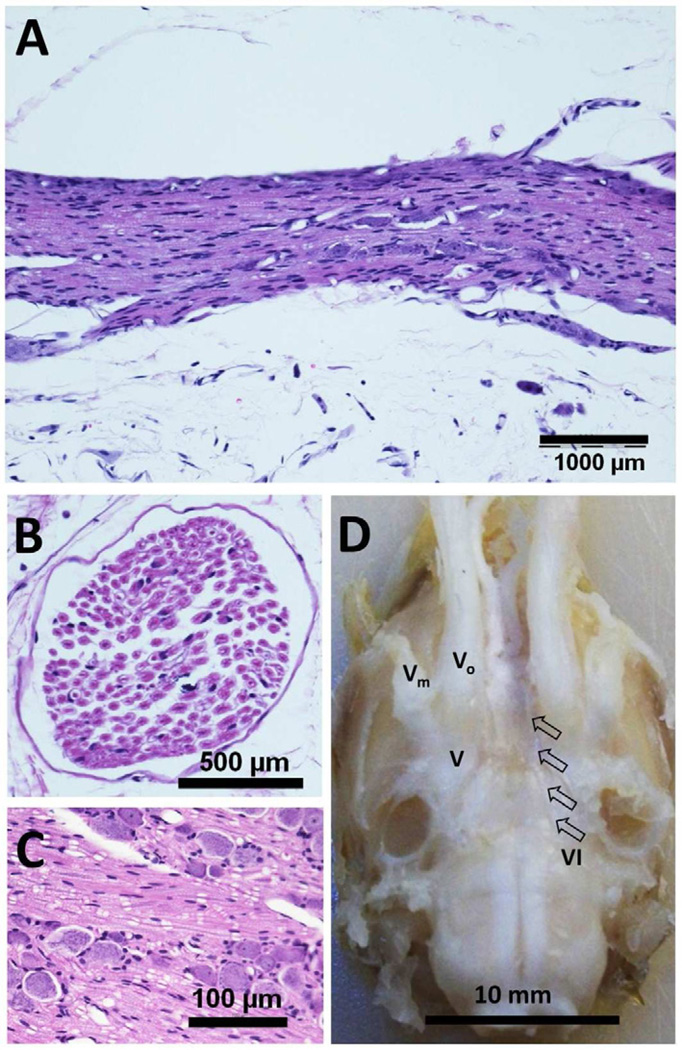
Figure 3.
An example of histological analysis of the sonicated rat cranial nerve (H&E Staining): (A) longitudinal, (B) transversal, and (C) magnified longitudinal section, along with (D) an extracted tissue sample (brain and cranial nerves) for histology analysis. Arrow indicates the abducens nerve (noted as ‘VI’, unilateral side) and the trigeminal nerve (noted as ‘V’, its ophthalmic and maxillary branches are denoted as ‘Vo’ and ‘Vm’ respectively) are also shown.

