Figure 1.
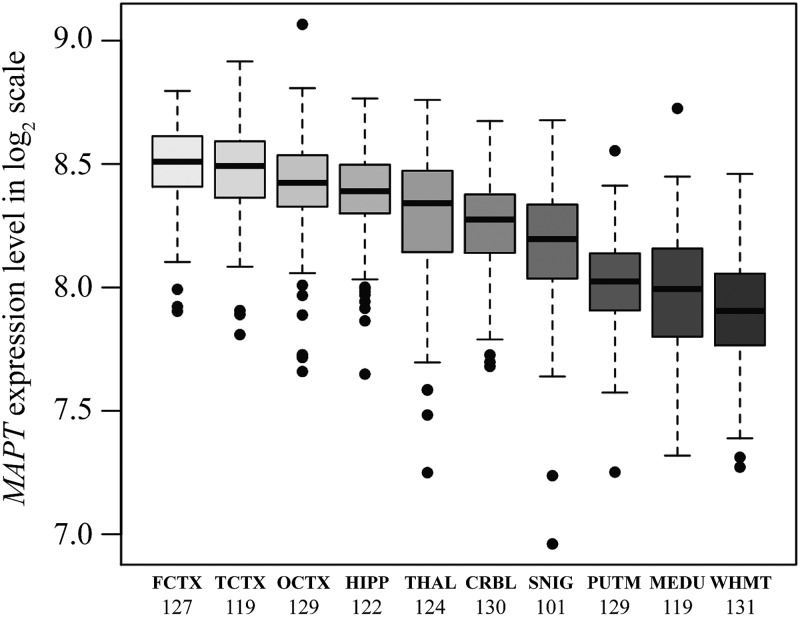
Regional distribution of MAPT mRNA expression: box plot of mRNA expression levels for MAPT in 10 brain regions, based on microarray experiments and plotted on a log2 scale (y-axis). This plot shows the variation in MAPT transcript expression across 10 brain regions: the frontal cortex (FCTX, n = 127), temporal cortex (TCTX, n = 119), occipital cortex (specifically primary visual cortex, OCTX, n = 129), hippocampus (HIPP, n = 122), thalamus (THAL, n = 124), cerebellum (CRBL, n = 130), substantia nigra (SNIG, n = 101), putamen (PUTM, n = 129), medulla (specifically inferior olivary nucleus, MEDU, n = 119) and intralobular white matter (WHMT, n = 131). Whiskers extend from the box to 1.5 times the inter-quartile range.

