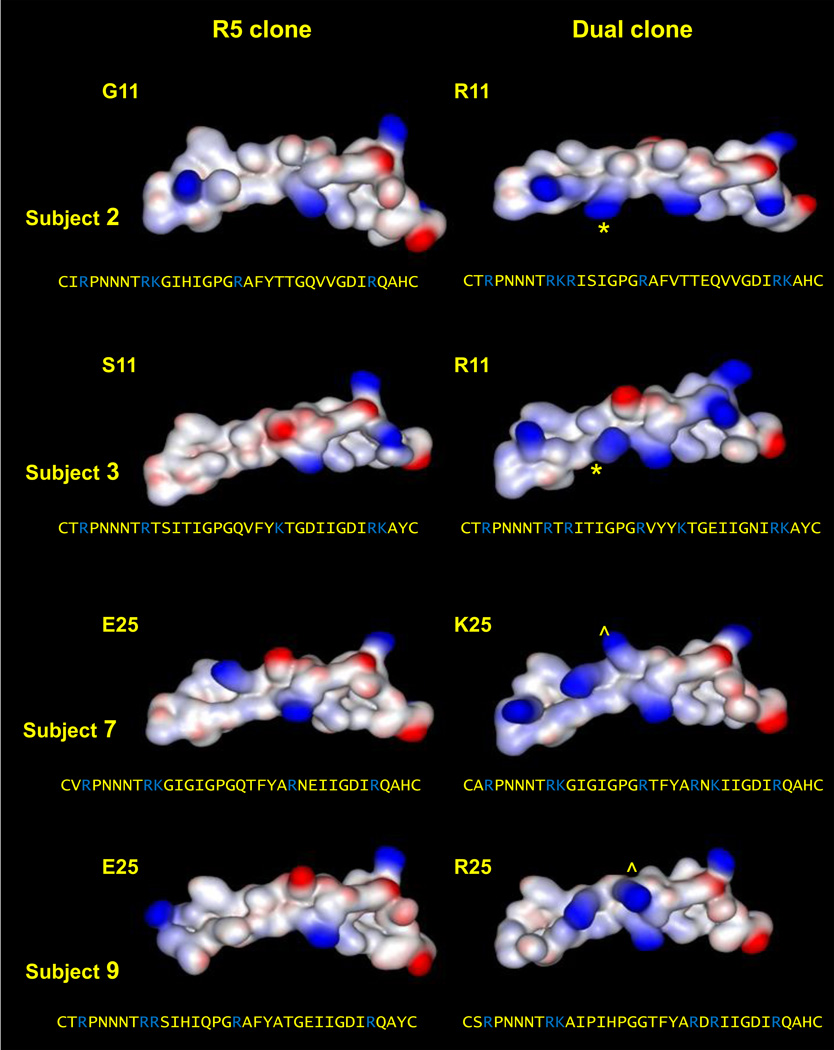
Figure 2. Structural modeling of the V3 regions of paired R5 and dual env clones from four patient virus populations.
Patterns of electrostatic charge across the V3 region are depicted (positive charges in blue, negative charges in red). Gains in positive charge at positions 11 and 25 are highlighted by * and ^, respectively. The V3 amino acid sequences are provided below each modeled structure, and basic amino acids are highlighted in blue. Subject 2 (G11 vs. 11R), subject 3 (S11 vs. 11R), subject 7 (E25 vs. 25K) and subject 9 (E25 vs. 25R).

