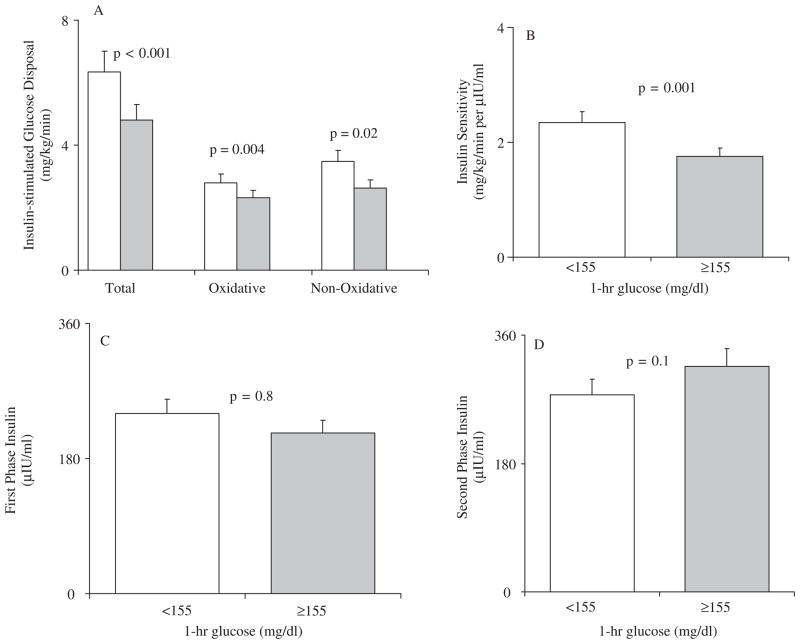
Fig. 1.
Insulin stimulated glucose disposal, total, oxidative and non-oxidative, (panel A), and insulin sensitivity (panel B) during the hyperinsulinemic–euglycemic clamp; and first and second phase insulin levels (panels C and D) during the hyperglycemic clamp in youths with 1-h plasma glucose concentration <155 mg/dL (blank bars, n = 69) and ≥155 mg/dL (gray bars, n = 44). Data represent the unadjusted means ± SEM. To convert to SI units multiply by 5.551 for insulin stimulated glucose disposal (μmol/kg/min), by 0.9252 for insulin sensitivity (μmol/kg/min per pmol/L), and by 6.0 for insulin (pmol/L).

