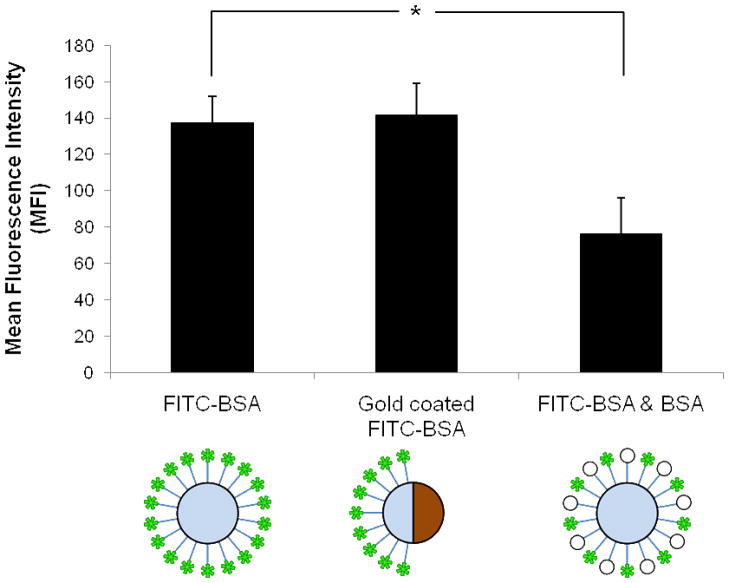
Figure 4.
Bar plot of the MFI for different procedures of particles functionalization of particles. Measurements are shown for single protein coating, single protein Janus particles, and mixed protein coating, as depicted by the schematics below each bar plot. The mixed protein coating consist of a mixture of FITC conjugated BSA and unlabeled BSA. The error bars represent the standard error.

