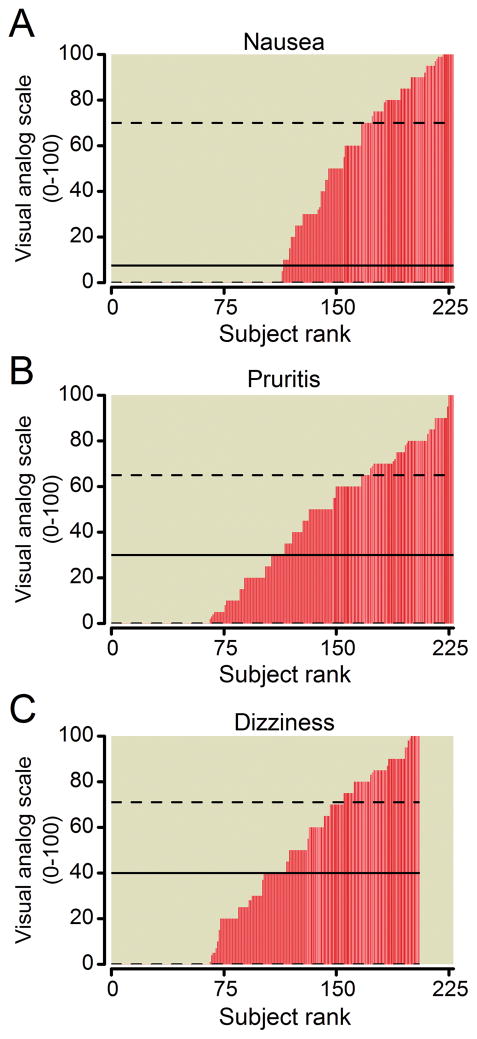
Figure 4.
Subjective aversive opioid effects were all assessed on a 100 mm visual analog scale (VAS). Participants were asked at the end of the infusion phase to provide ratings for average and maximum nausea, pruritus and dizziness. Average and maximum ratings correlated tightly (R = 0.89–0.92). Maximum scores are displayed in the figure. Results are ranked from smallest to largest along the x-axis. The VAS scores for nausea (A), pruritus (B) and dizziness (C) varied widely among participants, being absent in many but ranking close to the maximum in others. The solid and dashed lines indicate the median and the interquartile range, respectively.

