
Figure 4. 11β-HSD1 expression is induced by PPARγ in RM, M1 and M2 macrophages.
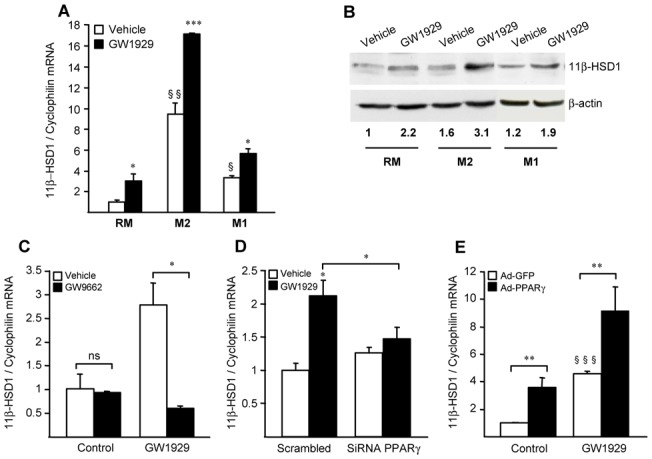
(A) RM, M2 and M1 macrophages were treated in the absence or in the presence of GW1929 (600nM); 11β-HSD1 mRNA level was measured by Q-PCR. Results are representative of three independent experiments. Statistically significant differences between control and treated cells (*p<0.05;**p<0.01;***p<0.001) and basal RM or M1 and M2 macrophages are indicated (§p<0.05;§§p<0.01). (B) Intracellular 11β-HSD1 and β-actin protein expression analyzed by western blot and immunoreactive band intensity was quantified. Results are representative of two independent experiments. (C) RM were treated with vehicle or the PPARγ antagonist GW9662 (1μM) in the absence or presence of GW1929 (600nM) for 24h. (D) RM were transfected with scrambled or human PPARγ siRNA and subsequently treated with GW1929 (600nM) or DMSO during 24h. (E) RM were infected with Ad-GFP or Ad-PPARγ and subsequently stimulated for 24h with or without GW1929 (600nM). 11β-HSD1 mRNA levels were measured by Q-PCR and normalized to those of cyclophilin. Results are expressed as the mean value ± SD of triplicate determinations, representative of three independent experiments. Statistically significant differences are indicated (*p<0.05;**p<0.01;***p<0.001).