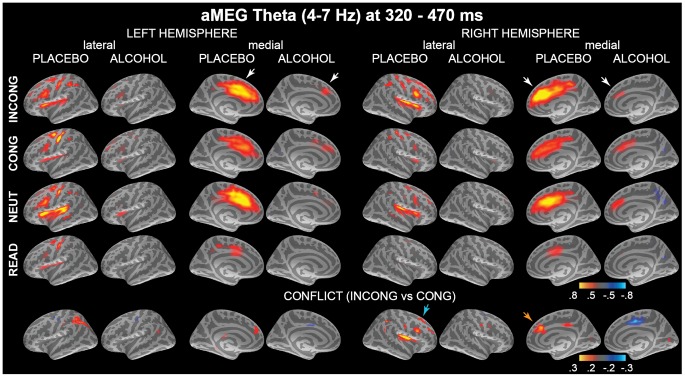
Figure 2. Group-average maps of event-related theta source power estimates in 320–470 ms time window.
Event-related theta power is elicited in the fronto-parieto-cingulate network with the ACC as the strongest estimated source, and is attenuated by intoxication (white arrows). The color scale depicts baseline-corrected noise-normalized source power expressed in arbitrary units. The bottom row shows conflict–related theta power (INCONG - CONG contrast) for both beverage conditions. The color scale denotes differential baseline-corrected source power estimates, with red-yellow indicating stronger theta power to INCONG. Conflict-related theta is attenuated by intoxication in the right prefrontal (cyan arrow) and ACC (orange arrow) cortices. CONG stimuli elicited stronger theta in the motor -related medial cortex due to motor preparation at this latency.

