
Figure 4. Group-average timecourses of response-locked theta source power estimates in the left ACC and MOT areas.
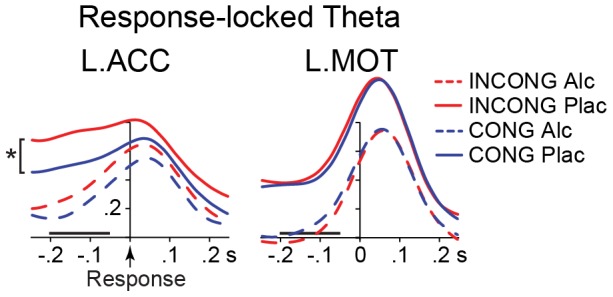
Time 0 ms corresponds to the button press. The time window immediately preceding motor responses is indicated by a horizontal bar. During this time, only ACC showed sensitivity to conflict with stronger theta on INCONG than CONG trials during placebo (* p<0.02), suggesting the ACC engagement in response selection and execution. Alcohol attenuated pre-response theta overall. The y-axis depicts baseline-corrected noise-normalized source power expressed in arbitrary units.