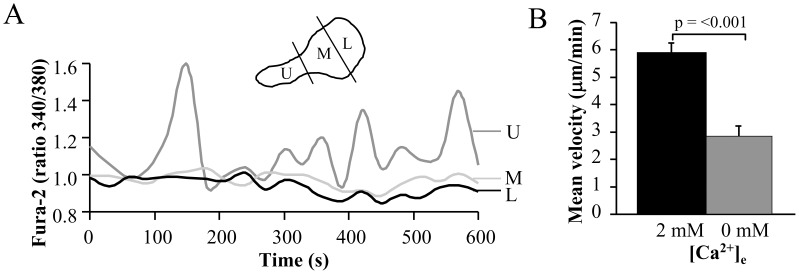
Figure 5. Intracellular Ca2+ concentrations and the effect of extracellular Ca2+ in migrating activated T cells.
A. Time-dependent intracellular Ca2+ levels in the uropod (U), mid-body (M) and leading-edge (L) in a representative migrating T cell. Cells were loaded with 1 µM Fura-2, and the Fura-2 340/380 ratio was quantified using the MetaMorph software. A scheme representing the different cell compartments of a polarized migrating cell is shown as inset. B. Effect of extracellular Ca2+ removal on T cell migration. The motility was determined by following the same cell in physiological [Ca2+]e (2 mM) and in Ca2+-free medium (0 Ca2+/EGTA). Control motility is the average motility over 20 min, while the motility in Ca2+ -free medium corresponds to the average of the last 5 min of 25 min in Ca2+-free medium. The data are the average of n = 17 cells from 2 different donors.

