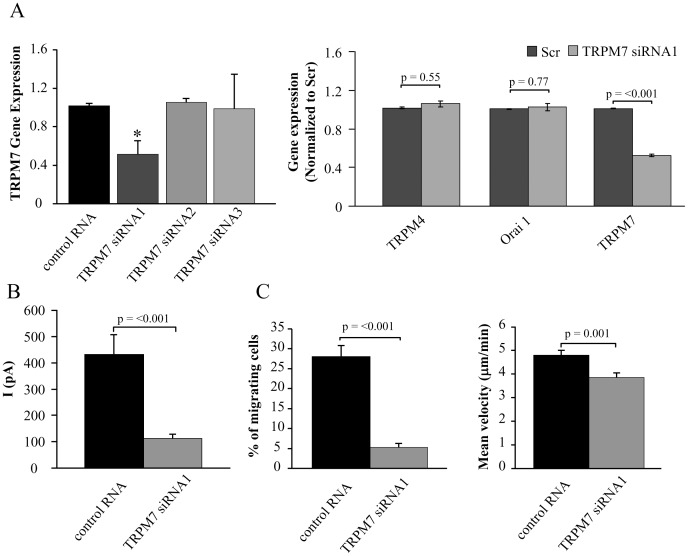
Figure 8. TRPM7 channels are crucial for T cell migration.
A. Left Panel: TRPM7 gene expression is reduced by siRNA1. TRPM7 gene expression was quantified by RT-qPCR and is given in fold change relative to GAPDH expression. The data are normalized to control RNA transfected cells and correspond to mean ± SEM of 3 healthy donors each in quadruplicate. Statistical significance was determined by One Way ANOVA, while post-hoc testing was done by Holm-Sidak method. * indicates statistical significance. Right Panel: Specificity of TRPM7 siRNA. Activated T cells were transfected with TRPM7 siRNA1 for 48 hours and the gene expression for TRPM4, Orai1 and TRPM7 was quantified by RT-qPCR. The data are shown as fold change in gene expression relative to GAPDH and are normalized to control RNA transfected cells. Data are presented as mean ± SEM for 3 independent donors, with samples in quadruplicate. B. TRPM7 knockdown decreases TRPM7 currents. The average TRPM7 current was significantly decreased in TRPM7 siRNA1 transfected cells (n = 13) compared to cells transected with control RNA (n = 10). Transected cells were visualized by GFP expression. C. Effect of TRPM7 siRNA1 on T cell migration. On the left panel is reported the % of cells migrating. The total number of cells were for control RNA 626 (n = 5 experiments; 2 donors) and for TRPM7 siRNA1 796 (n = 8 experiments; 2 donors). Right panel: T cell migration was measured in TRPM7 siRNA1 transfected cells (n = 40) and compared to control RNA transfected cells (n = 49) from 2 individuals.

