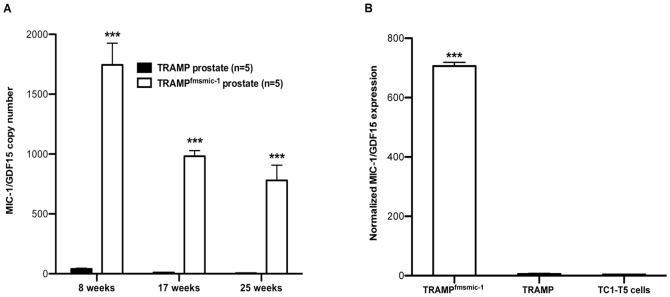
Figure 3. MIC-1/GDF15 expression in TRAMP and TRAMPfmsmic-1 prostate and TC1-T5 cell line.
(A) MIC-1/GDF15 expression was quantified by qRT-PCR in the prostate of TRAMP and TRAMPfmsmic-1 mice at 8, 17 and 25 weeks and normalized to B-actin expression as described in material and methods. (B) Relative MIC-1/GDF15 expression was quantified by qRT-PCR in the TC1-T5 cell line (n = 3) and compared with TRAMP (n = 3) and TRAMPfmsmic-1 (n = 3) prostate tumor after normalizing with TBP expression. Values are presented as mean normalized MIC-1/GDF15 expression ±SEM. p values for the two-tailed unpaired t test are shown as ***p<0.001.

