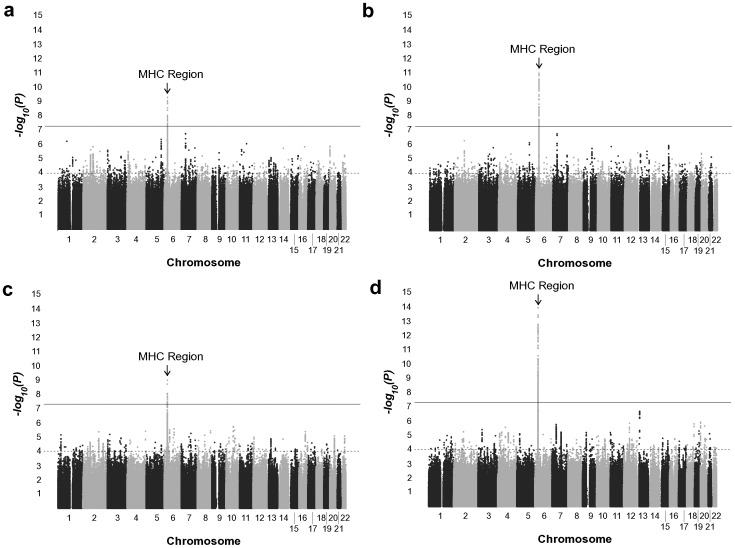
Figure 2. Manhattan plots of SNP-sarcoidosis association test results.
(A–D) Association results in the AA discovery set (A), a meta-analysis between the AA discovery and AA replication sets (B), the EA dataset (C), and a meta-analysis of the AA discovery, AA replication and EA datasets (D). The black horizontal line represents the threshold for genome-wide significance (P<5×10⁻⁸) and the gray line is the suggestive evidence of association threshold (P<1×10⁻⁴).

