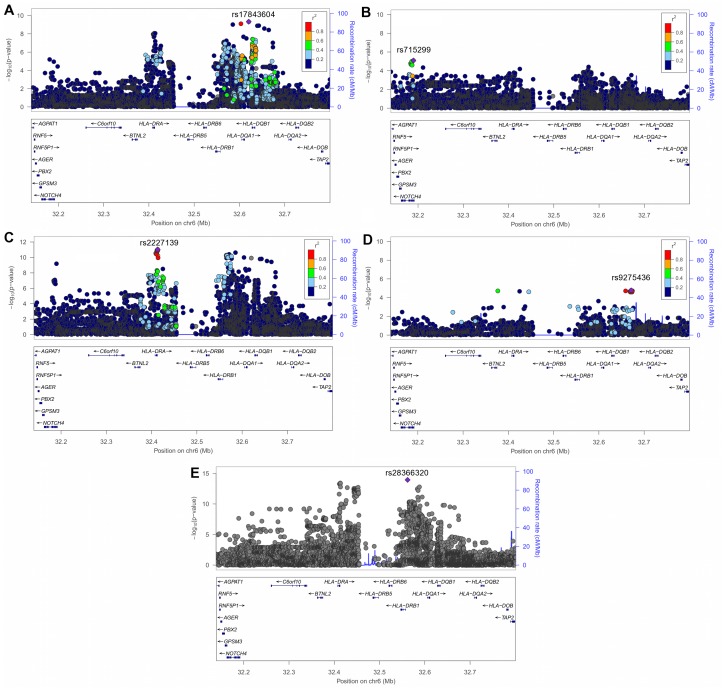
Figure 3. Regional association plots of SNP-sarcoidosis association test results within the MHC Class II region.
(A–D) Association results in the AA discovery set (A), AA replication set (B), a meta-analysis between the AA discovery and AA replication sets (C), the EA dataset (D), and a meta-analysis of the AA discovery, AA replication and EA datasets (E). Each SNP is colored according to its LD (r 2) with the top SNP, except for (E) since the meta-analysis was performed on two different populations. The recombination rate is denoted by the blue solid line. Plots were drawn using LocusZoom [100].

