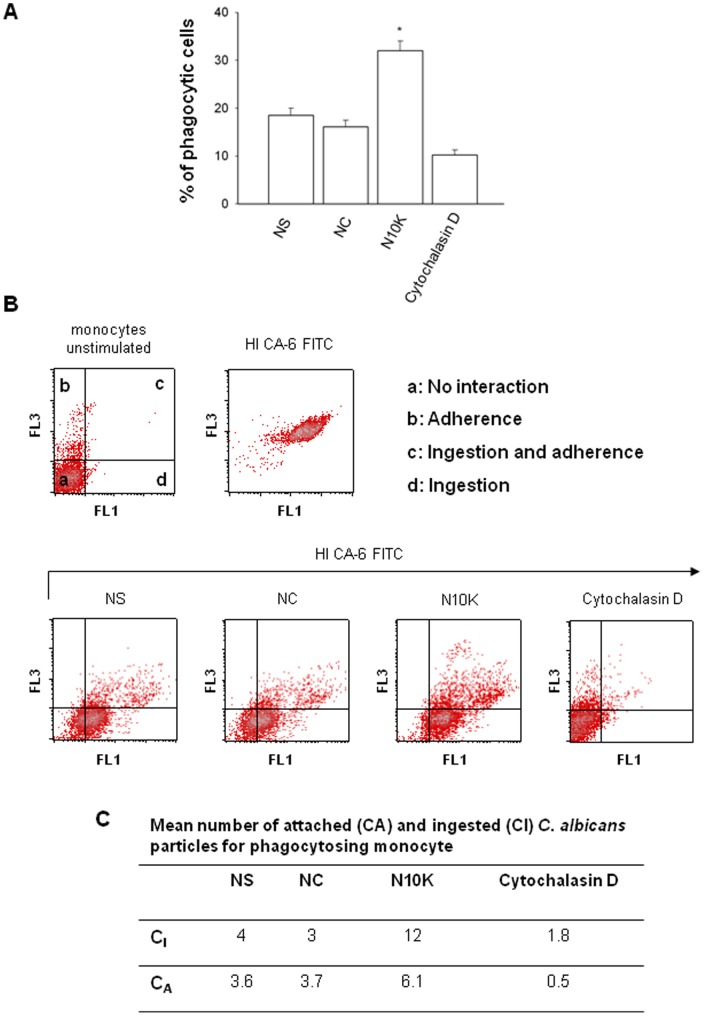
Figure 7. Phagocytosis of C. albicans cells.
Monocytes (1×10⁷/ml) were incubated for 30 min in the presence/absence of NC, N10K (both 10 µg/ml) or Cytochalasin D (30 µM) and subsequently incubated with heat inactivated FITC-labelled yeast cells (HI CA-6) for 30 min. Percentage of phagocytic cells was determined by flow cytometry (A). *, P<0.05 (n = 7; N10K treated vs untreated cells). Error bars denote s.e.m. Monocytes (1×10⁷/ml) were treated as above described. Quantification of recognition and ingestion of yeast cells were determined by flow cytometry. Dot plots of the distribution of green (FL1) and red (FL3) fluorescence are shown in panel B. Four distinct cell subsets are identified, which coincide with four types of monocyte-yeast interaction: quadrant a, no interaction; quadrant b, adherence; quadrant c, ingestion and adherence; quadrant d, ingestion (B). Panel C shows the mean number of attached (CA) and ingested (CI) C. albicans particles per each phagocytosing monocyte calculated using data from plots of panel B (see Materials and Methods section).

