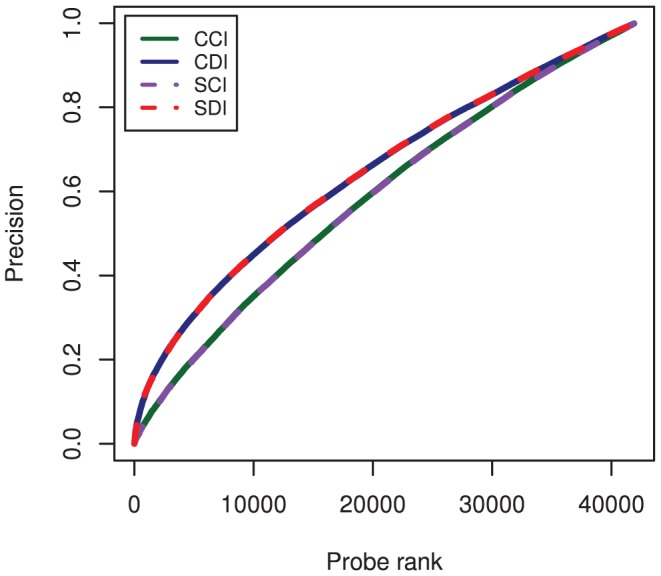
Figure 7. Average precision curves, calculated as the number of top n position weight matrix-based scores and experimental PBM fluorescence intensities in common.

Precision curves were generate for cross scoring of completely-identical pairs (CCI), cross scoring of domain-identical pairs (CDI), self scoring of completely-identical pairs (SCI), and self scoring of domain-identical pairs (SDI) listed in Figure 1. The average precision is nearly exactly overlaying for CCI and SCI, as well as CDI and SDI, owing to the ability of self and cross PWM scans to equivalently capture the DNA binding properties in the PBM data. As with the Spearman correlation coefficients in Figure 4, the average precision for the domain-identical data set actually outperformed the completely-identical transcription factor pair scoring, reflecting the more challenging nature of the completely-identical data set (see text for details).
