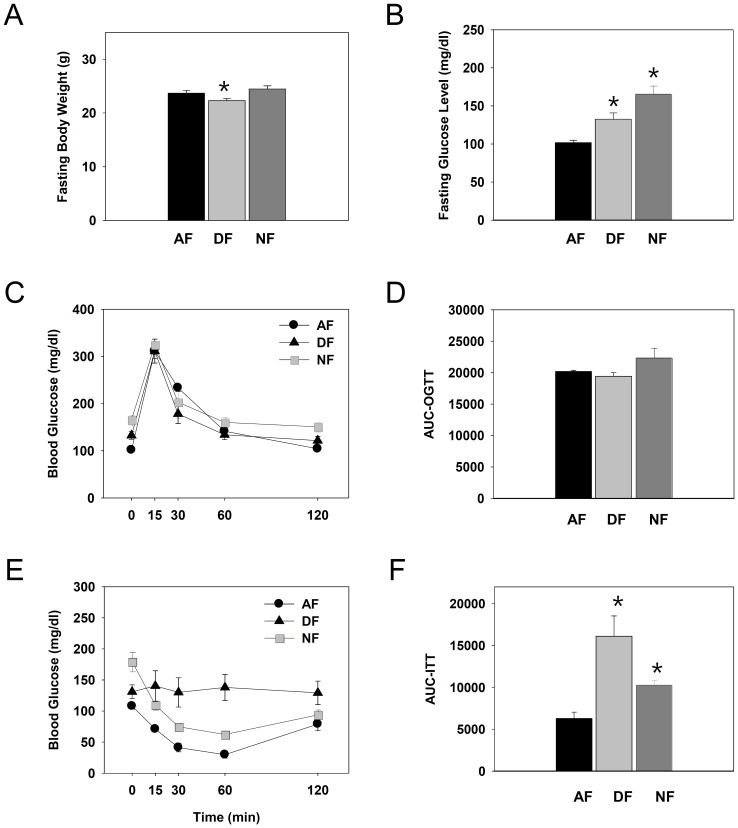
Figure 8. Effects of chronic time-restrictive feeding on body weight, fasting blood glucose, glucose tolerance, and response to insulin.
Young adult male mice were first entrained to a 12∶12 LD photoperiodic cycle for 2 weeks and then fed time-restrictively for 9 consecutive weeks. After 16 h fasting, mice were weighed (A) and fasting glucose levels were measured (B) at the 5th week. Then oral glucose tolerance test was performed. Blood glucose levels over time in response to an oral glucose load (C) and area under the curve for OGTT (D) are shown. At the 9th week, mice were weighed after 16 h fasting, and fasting glucose levels were measured. Then insulin tolerance test was performed. Blood glucose levels over time in response to insulin (E) and area under the curve (F) were determined. All data are expressed as mean ± S.E.M. (n = 3–4), *p<0.05 vs. control AF group.

