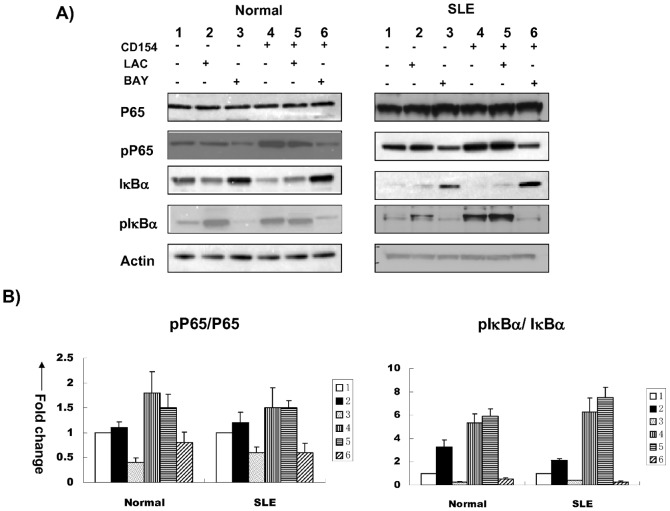
Figure 6. The effects of different signaling inhibitors on CD40-induced activation of NF-κB in lupus and normal B cells.
IκBα, pIκBα, P65, and pP65 levels in normal and B cells from lupus patients before and after stimulation with recombinant CD154 in the presence or absence of lactacystein (LAC, 30 uM) and BAY11-7082 (BAY, 30 uM) were tested by western blot (Fig. 6). 6A: Results from one of five independent experiments. 6B: Relative band density ratio of pP65/P65 and pIκBα/IκBα in lupus and normal B cells. The relative band densities of pP65/P65 and pIκBα/IκBα with CD154 stimulation compared to no stimulation in normal controls and SLE patients were 1.8±0.43, 5.33±0.8 and 1.5±0.4, 6.25±1.23 respectively (p<0.05). For inhibition test, compared with baseline levels (no CD154, no inhibitors), the relative band densities of pP65/P65 with LAC inhibition (no CD154) and BAY(no CD154) in normal controls were 1.1±0.12 (p>0.05) and 0.4±0.09 (p<0.05), in SLE patients were 1.2±0.21 (p>0.05) and 0.6±0.11 (p<0.05); the relative band densities of pIκBα/IκBα with LAC inhibition(no CD154) and BAY (no CD154) in normal controls were 3.28±0.6 (p<0.05) and 0.27±0.06 (p<0.05), in SLE patients were 2.1±0.16 (p<0.05) and 0.39±0.04 (p<0.05). When stimulated with CD154, compared with that with CD154 stimulation but no inhibitors, the relative band densities of pP65/P65 with LAC inhibition (plus CD154) and BAY(plus CD154) in normal controls were 1.5±0.28 (p>0.05) and 0.8±0.21 (p<0.05) respectively, in SLE patients were 1.5±0.15 (p>0.05) and 0.6±0.19 (p<0.05) respectively.; the relative band densities of pIκBα/IκBα in normal controls were 5.9±0.62 (p>0.05) and 0.53±0.1 (p<0.05) respectively, in SLE patients were 7.5±0.91 (p>0.05) and 0.26±0.08 (p<0.05)respectively. There was no statistical difference between normal controls and SLE patients at each comparison (p>0.05).

