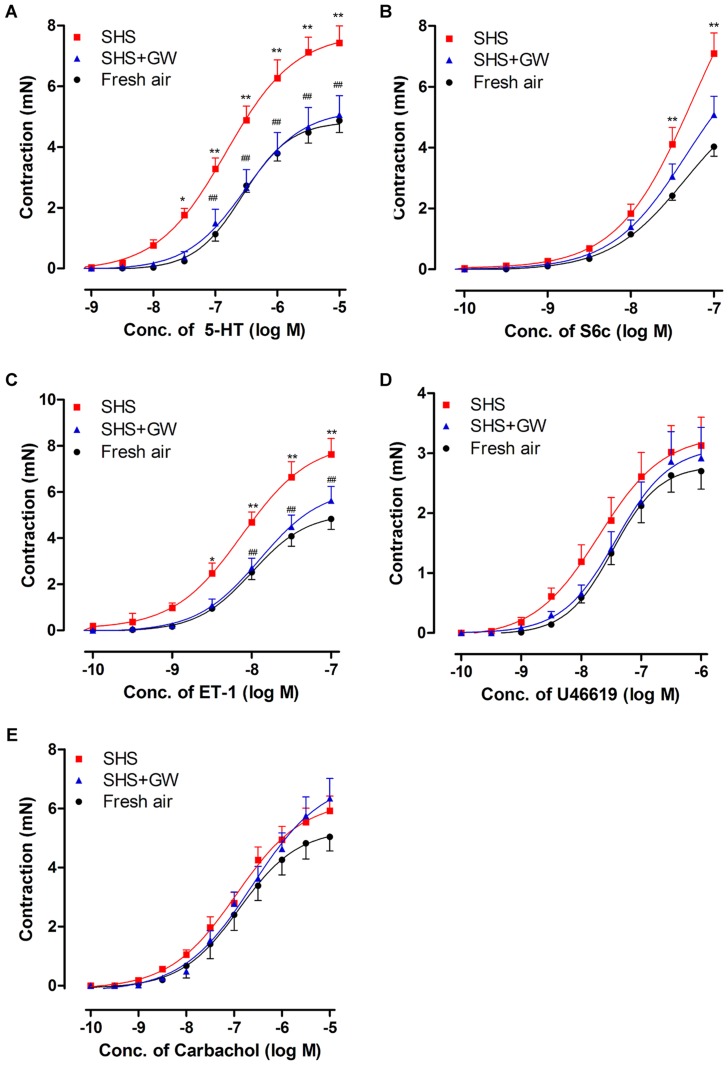
Figure 1. Contractile responses to the receptor agonists.
The bronchial segments were from rats that were exposed to fresh air, SHS and SHS + GW5074. The response curves were induced by cumulative application of 5-HT (A), S6c (B), ET-1 (C), U46619 (D) and carbachol (E), respectively. The contractions are shown in absolute mN. The values are expressed as the mean ± SEM (n = 8–10). The statistical analysis was performed using two-way ANOVA with Bonferroni's post-test. *P<0.05, ** P<0.01 vs. fresh air exposure group; ## P<0.01 vs. SHS exposure group.

