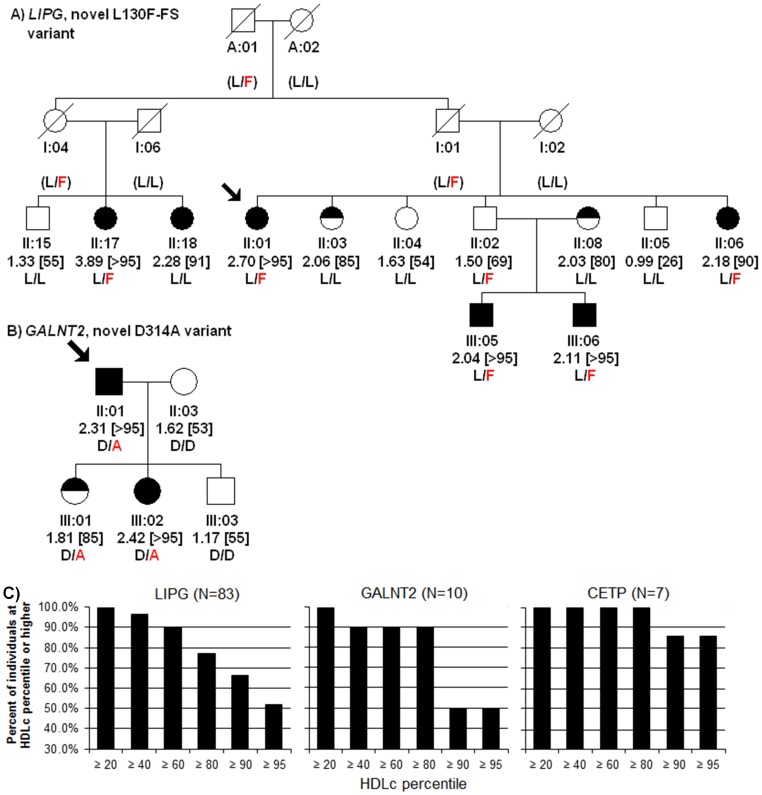
Figure 2. Representative segregation of mutations in families.
A, B) Segregation of (A) LIPG L130F-FS and (B) GALNT2 D314A with elevated HDLc. For each individual, the individual ID, HDLc (in mmol/L) plus [HDLc percentile], and genotype are shown. Squares, Males; Circles, Females; Arrow, proband. Filled shape, HDLc≥90th percentile; half-filled, HDLc between 80–89th percentiles; empty shape, HDLc<80th percentile. Slash = deceased. C) Percent of individuals in families with mutations at given HDLc percentiles or higher.

