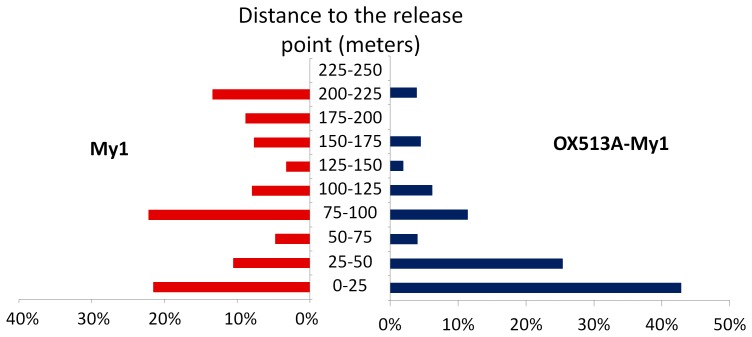
Figure 4. Difference in dispersal of My1 and OX513A-My1 males.
Proportion of the total trap density corrected recaptures [46] calculated according to the distance from the release point by concentric annuli of 25 m. Most of the OX513A-My1 males (68%) were caught in the first two annuli surrounding the release point, i.e. <50 m, while the My1 males are more evenly distributed among the annuli (from 3% to 22%). This accounts for the latter higher Mean Distance Travelled (MDT), Flight Range 50 (FR50) and Flight Range 90 (FR90). (My1 males: red; OX513A-My1 males: blue).

