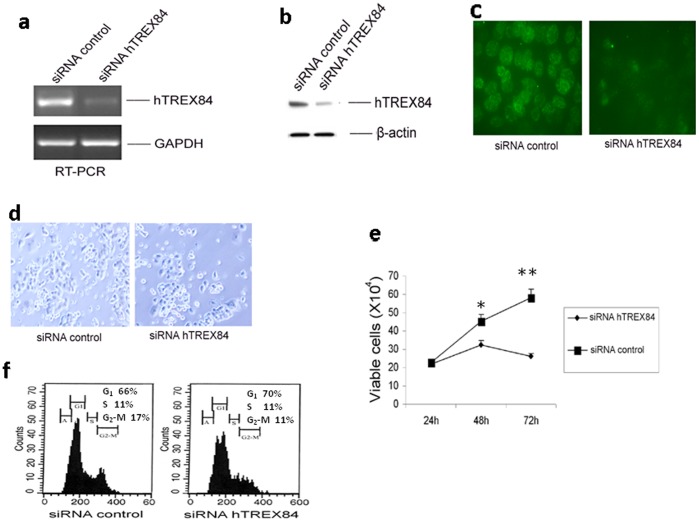
Figure 2. Depletion of hTREX84 leads to defects in cellular proliferation of OVCAR10.
A, Analysis of hTREX84 and GAPDH mRNA levels following treatment of cells with siRNA against hTREX84 or control siRNA. B, Analysis of hTREX84 and β-actin protein levels after treatment of cells with siRNA against hTREX84 or control siRNA. C, Analysis of hTREX84 expression following siRNA treatment for 72 hours by immunofluoresence staining in the cells (left, cells transfected with control siRNA; right, cells treated with hTREX84-siRNA). D, Photomicrographs showing the morphology following depletion of hTREX84 (left, tumor cells transfected with control siRNA; right, cells treated with hTREX84-siRNA). E, Cell proliferation assay of tumor cells following depletion of hTREX84. Cell proliferation and apoptosis (data not shown) was examined using Guava ViaCount and Nexin assays respectively. The number of viable cells (x104) are plotted against treatment duration at 24, 48, and 72 hrs after treatment with control siRNA or with hTREX84-siRNA. Shown are the results of three independent experiments. The difference is statistically significant. *, p<0.05; **, p<0.01. F. FACS analysis of the cells following down-regulation of hTREX84 levels. Shown is the percentage of cells in G1, S, G2-M after 72 hour of treatment with either siRNA (left panel) or hTREX84-siRNA (right panel).

