
Figure 6. Inferred gene regulatory network [10], [16].
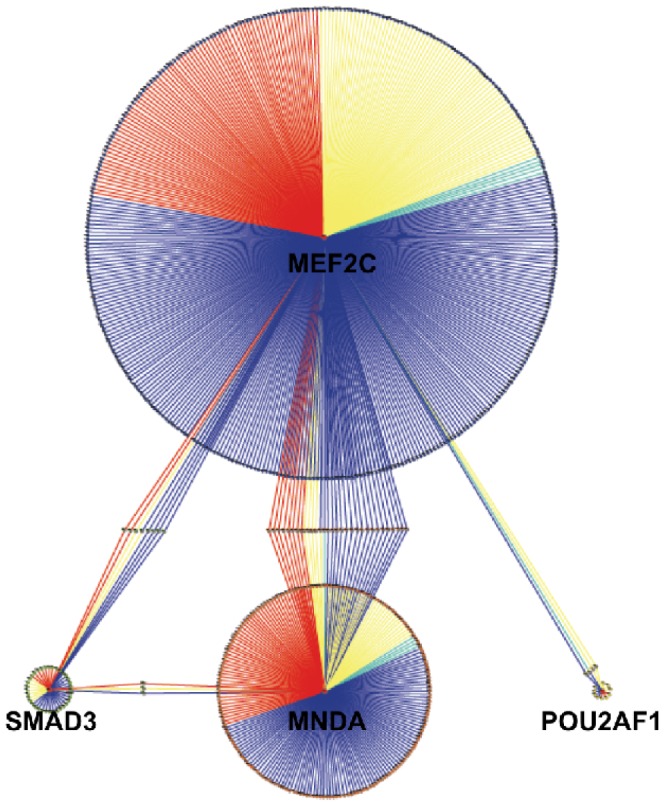
Links colored in red represent interactions associated (in the literature, from data mining) with breast cancer, yellow links are interactions associated with other types of cancer, turquoise links are interactions associated with metabolic disorders and navy blue links are otherwise. We could notice that some genes are regulated by more than one of these transcription factors as is the case with RAD52, ADH1C, OIP5, ELK4, PEX10, GAA, FTHP1 and ADAP1 which are co-regulated by MEF2C and SMAD3; of STMN1, STAU1 and the c10ORF10 transcript which are co-regulated by SMAD3 and MNDA; of CSH1, FANCI, FHIT, CDKN2A, PRC1, CENPF, MAP3K1, BNIP3, HCLS1, TAF15, PCBP2, SPAI7, SLC38A1, PASK, HIST1H2BD, POLR2I, UPK3B, EHD1, PRICKLE3, LOC91316, ANAPC2, LST1, RRP12, c9ORF6, BRP44, CLEC4A, TMEM194A, TPO3B, HIST1H2AM and ZFP37 which are co-regulated by MEF2C and MNDA; and by c14ORF1, DOK5, AFF1, and CADM4 which are co-regulated by MEF2C and POU2AF1. In the case of these double-regulatory interactions there are some cases in which both regulatory interactions are associated with a certain phenotype and other cases in which different (or no) phenotype is associated for each link.