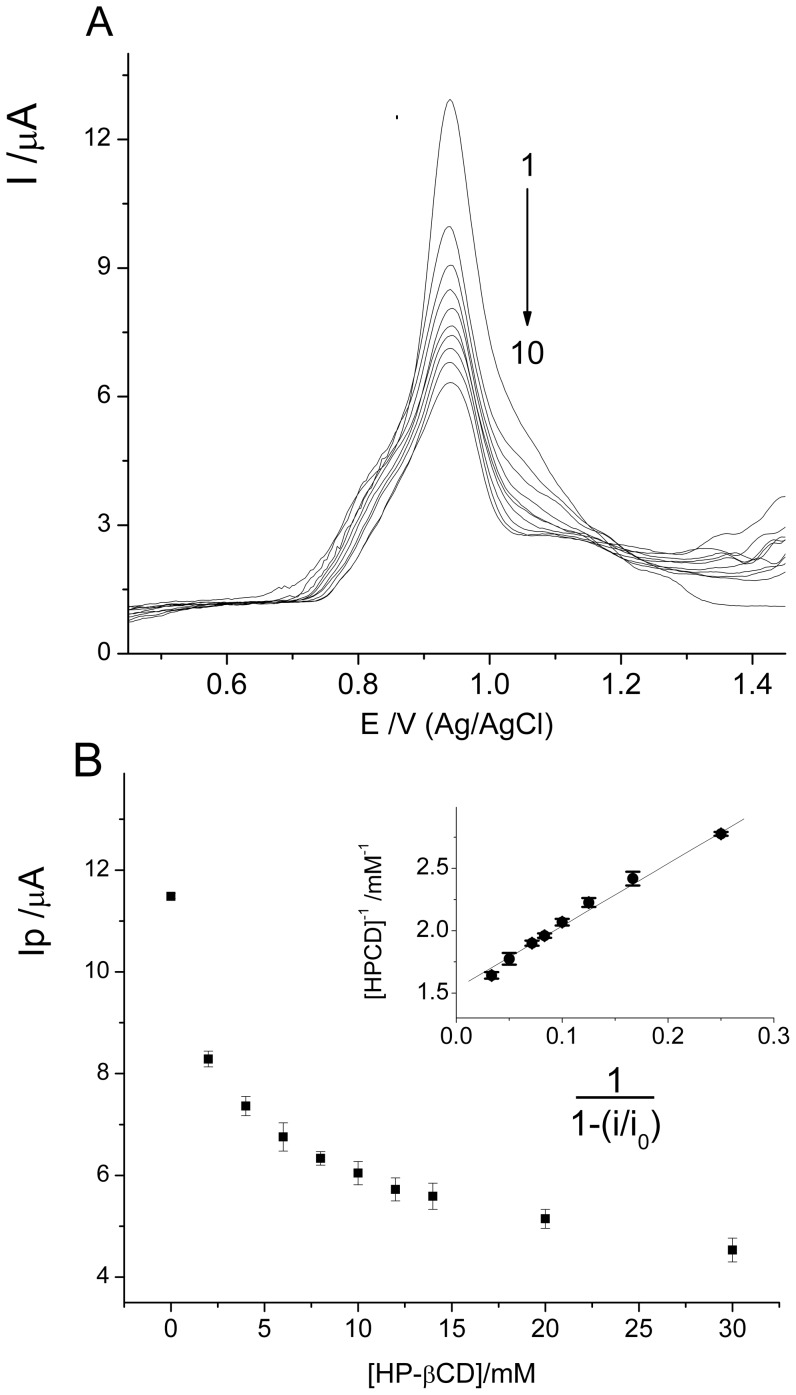
Figure 2. Electrochemical oxidation of bentazon.
(A) Differential pulse voltammetry curves for 5.0×10⁻⁴ M Btz in buffer phosphate pH 6.0 in the absence and presence of different HPCD concentrations. Curves 1–10: 0, 2, 4, 6, 8, 10, 12, 14, 20 and 30 mM HPCD; (B) Current dependence on the concentration of HPCD for bentazon in buffer phosphate pH 6.0. Current values obtained from DPV measurements. Inset: Plot of 1/[CD] versus 1/(1-I/I0) for bentazon in buffer phosphate pH 6.0.

