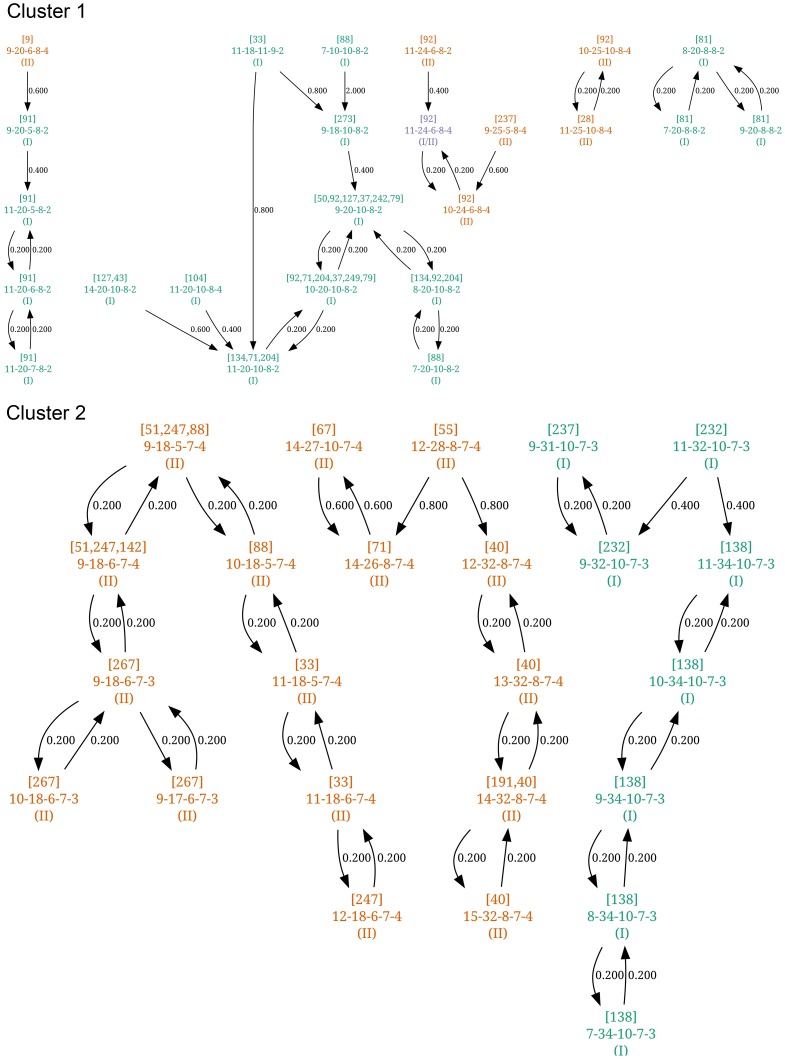
Figure 6. Structure-neighbor clustering analysis of MLVA profiles.
Two clusters are defined. Within each cluster, each profile is connected to its nearest neighbor(s) and the corresponding distance is indicated (the mean difference between the number of repeats). Each profile is identified by: [Number of Cat(s)]/VNTR profile/(16SrRNA genotype).

