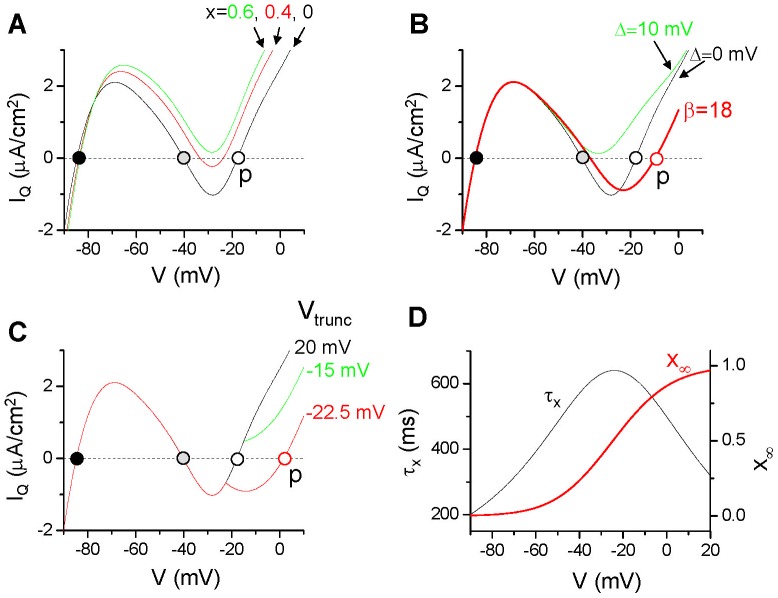
Figure 6. Quasi-steady state I-V curves.
A. The quasi-steady state whole-cell current (IQ) vs. voltage in the original model with  = 0.15 mS/cm2 with x set at different constant values (as marked). B. IQ vs. voltage with x = 0 for the original model (Δ = 0), 10 mV shift in f∞ (Δ = 10 mV), and f∞ slope reduced (β = 18). C. IQ vs. voltage with x = 0 for different Vtrunc. D. Activation time constant (τx) and the steady-state action curve (x∞) of IK vs. voltage from the original LR1 model.

