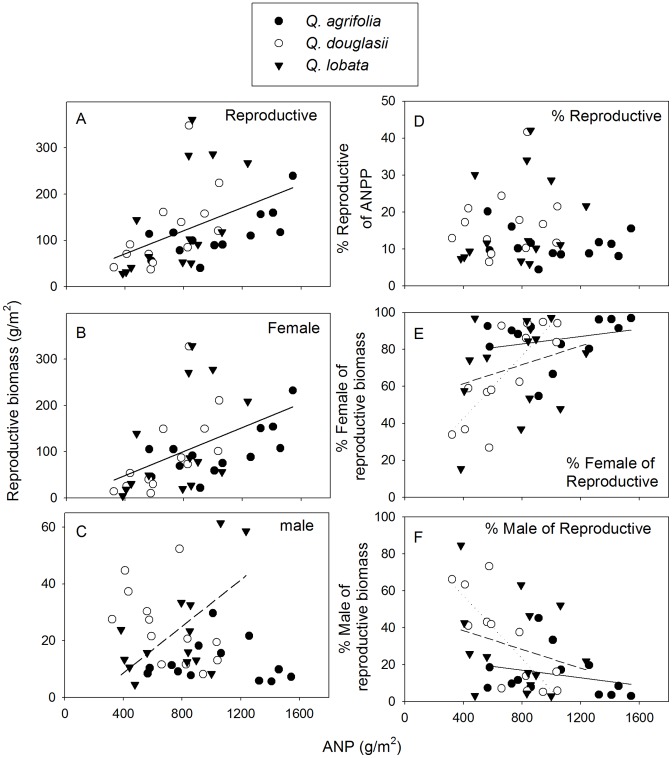
Figure 3. Annual aboveground net productivity (ANP) in three California oak species in relation to reproduction.
Shown are ANP in relation to (A) total reproductive biomass, (B) female reproductive biomass, (C) male reproductive biomass, (D) percent reproductive biomass of ANP, (E) percent female reproductive biomass of total reproduction, and (F) percent male reproductive biomass of total reproduction. Plotted are the five year means of the 40 individual trees. ANP was calculated from aboveground litterfall and an estimate of trunk increment based on dendrometers. Lines are drawn for species averages in A and B, Q. lobata only in C, and in E and F solid line for Q. agrifolia, long dashed line Q. lobata and short dashed line Q. douglasii based on GLMs (Table 2). For Q. lobata only there was a significant positive relationship between ANP and male allocation (R 2 = 0.38, P<0.02).

