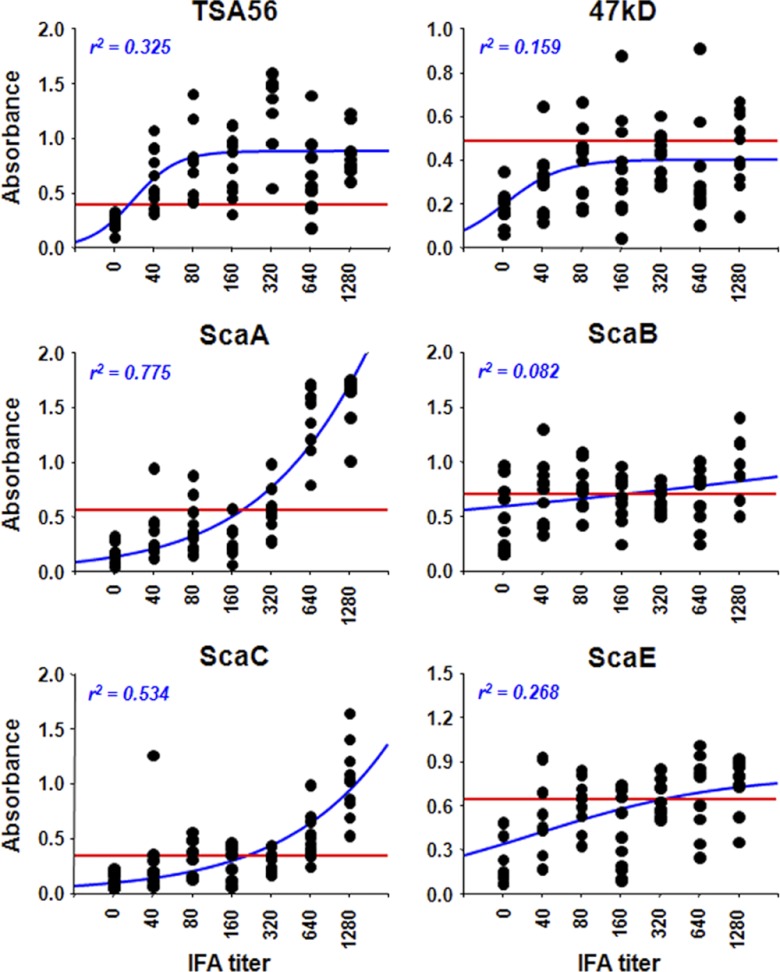
Fig 3.
Comparison of ELISA data obtained using the indicated antigens and IFA titers. The reactivities of the sera (10 samples per IFA titer) were assessed by ELISA and plotted against IFA titers. The cutoff values (red lines) were determined using IFA-negative sera from 10 healthy volunteers (mean plus 2 standard deviations). Correlations between ELISA results and IFA titers were assessed by nonlinear regression analysis (blue lines), and the r2 values are shown.

