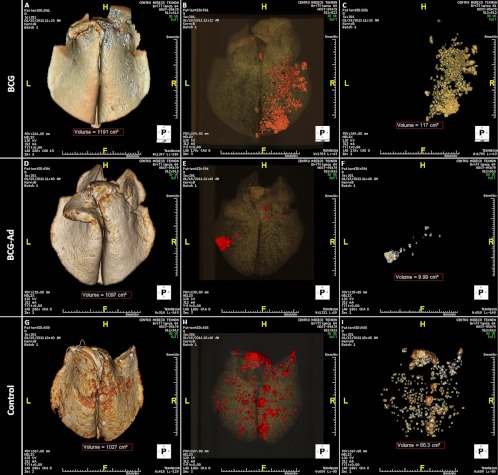
Fig 3.
Multidetector computed tomography analysis of gross lung lesions. Representative lungs from goats in treatment groups BCG (A to C), BCG-AdAg85A prime-boost (D to F), and control (G to I) are shown. (A, D, and G) Three-dimensional reconstructions of the whole lung. (B, E, and H) Volume-rendering images of the whole lungs with the different tissue densities discriminated by color: water in gray, air in black, and TB lesions in red. Total volumes of the lungs are shown in red dashed boxes. (C, F, and I) Volume-rendering images of the affected lungs showing only lesions. Total volumes of the affected lungs are shown in red dashed boxes. Lung orientation is indicated as follows: H, head; F, foot, L, left, R, right.

