
Fig 6.
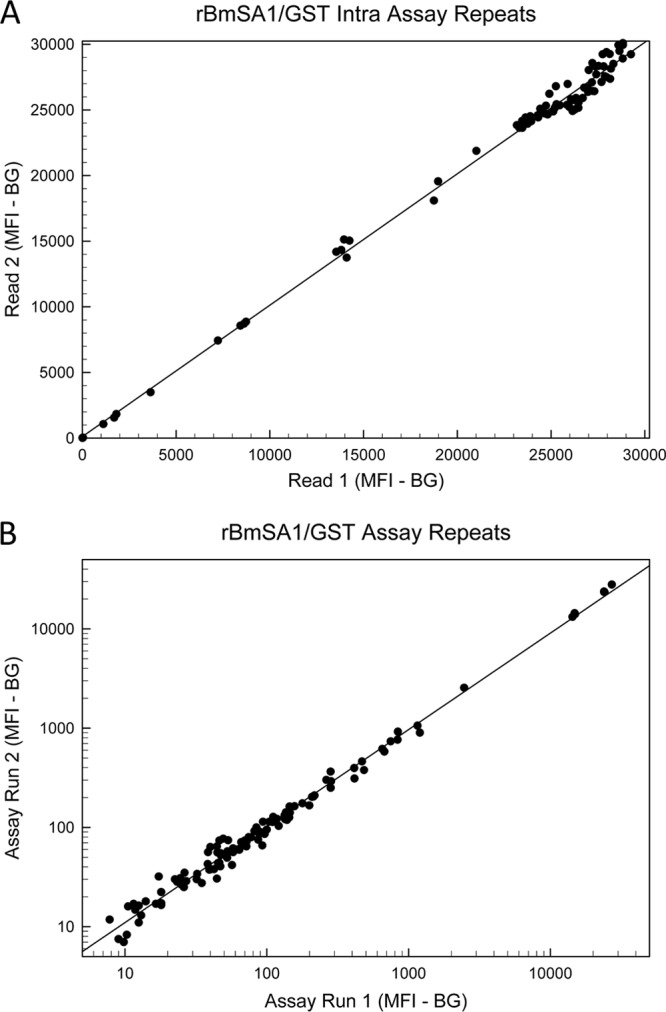
Reproducibility of the rBmSA1/GST MBA assay. (A) MBA values (MFI−BG) for assay plates that were run consecutively on two different Bio-Plex instruments on the same day; (B) MBA values (MFI−BG) for samples that were independently assayed approximately 2 weeks apart. Note that the values in panel B are plotted on a logarithmic scale to allow visualization of a wider range of values. Least-squares regression lines are given in both plots. The positive cutoff value for the rBmSA1/GST MBA was determined to be 1,122 MFI−BG units.