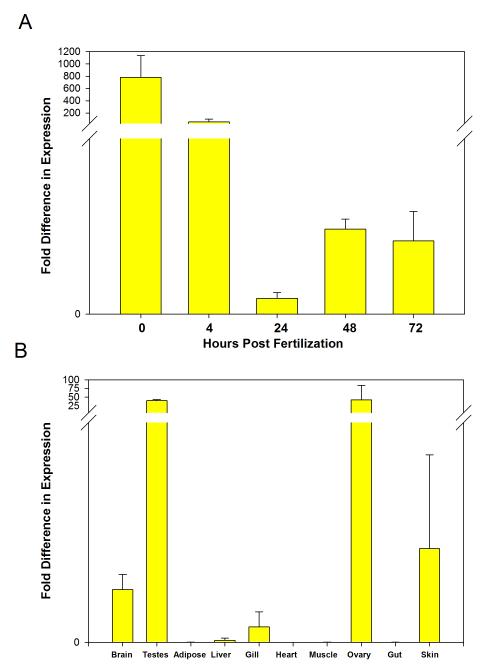
Figure 1. Expression of zebrafish leptin A as estimated by quantitative PCR.
cDNA for leptin A was amplified via qPCR and normalized against expression of ribosomal protein L13A. Values represent average of three samples/tissue (error bars are standard error). A) Relative expression in whole zebrafish embryos at five time points after fertilization. Leptin mRNA generally decreases post fertilization. B) Relative expression among adult tissues. Expression is highest in gonads.

