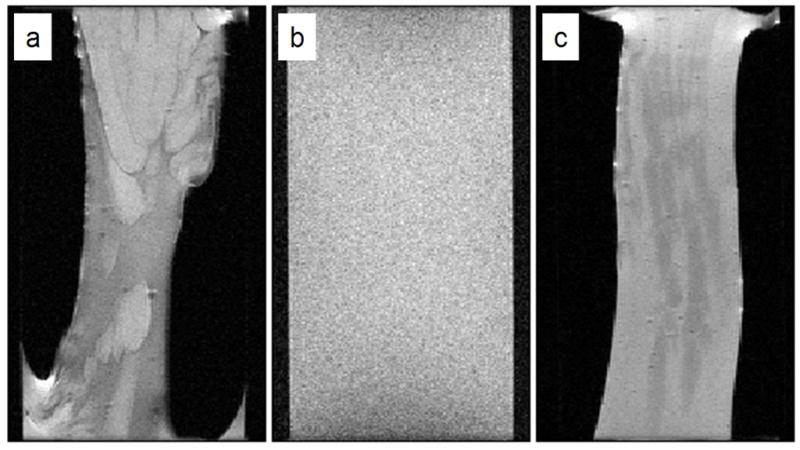
Figure 2.

MRI images of alginate gels obtained from (a) FRD1153, (b) algae, and (c) FRD1. These T2 maps demonstrate the variation in heterogeneity between the three gels prepared in the same fashion. These images were obtained after the gelation process had been completed and the bulk water drained. The images have a FOV of 20 mm in the frequency encode direction and 13 mm in the phase encode direction, the resulting resolution being 78 × 102 μm over a slice thickness of 1 mm. Sixteen echoes were collected with a TE = 11 ms and the TR = 1 s.
