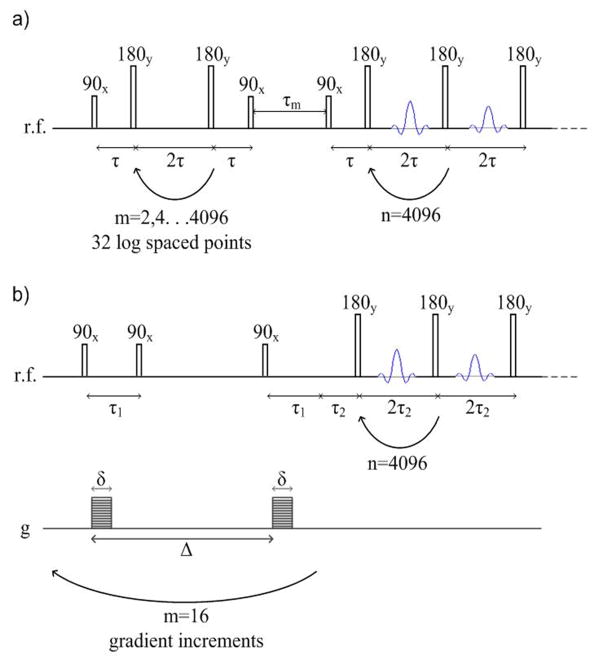
Figure 3.
2D diffusion and relaxation correlation MR pulse sequences. Both utilize a CPMG measurement with a 2τ spacing of 400 μs and 4096 echoes in the direct dimension. a) T2-T2 pulse sequence, which encodes for T2 relaxation in the indirect dimension by applying a logarithmically varying number between 2 and 4096 series of 180 pulses. b) D-T2 pulse sequence, which encodes for diffusion in the indirect direction using a stimulated echo PGSE sequence with 26 linearly varying gradient pulses between g = 0 and 1.48 T/m.

