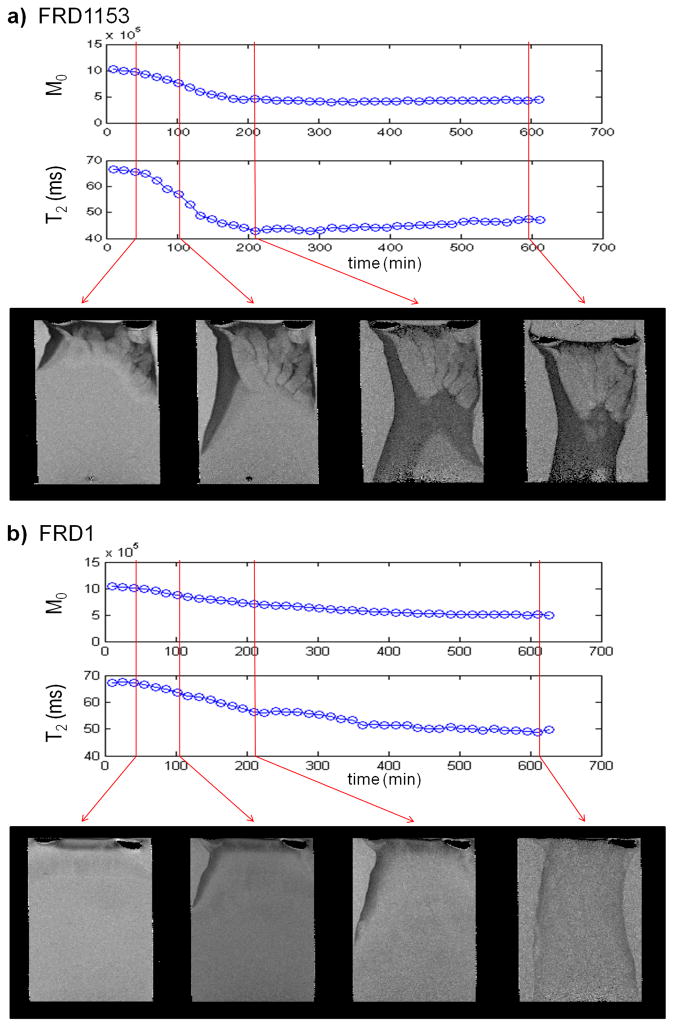
Figure 4.
Magnetization amplitude (M0), spin-spin relaxation (T2) and images with increasing time during gelation for (a) FRD1153 and (b) FRD1 alginates showing a difference in rate of gelation as well as heterogeneity. The 2D MR images have a resolution of 78 × 102 μm2 over a 1mm thick slice fixed in the middle of the column. The M0 and T2 values are obtained from a 0.5 mm thick slice perpendicular to the gelation direction and fixed approximately 10 mm below the top of the gel. The FRD1153 gel shows more heterogeneity in the images. The faster decay in both the M0 and T2 indicate the gel formed by the FRD1153 also forms more quickly than the FRD1.

