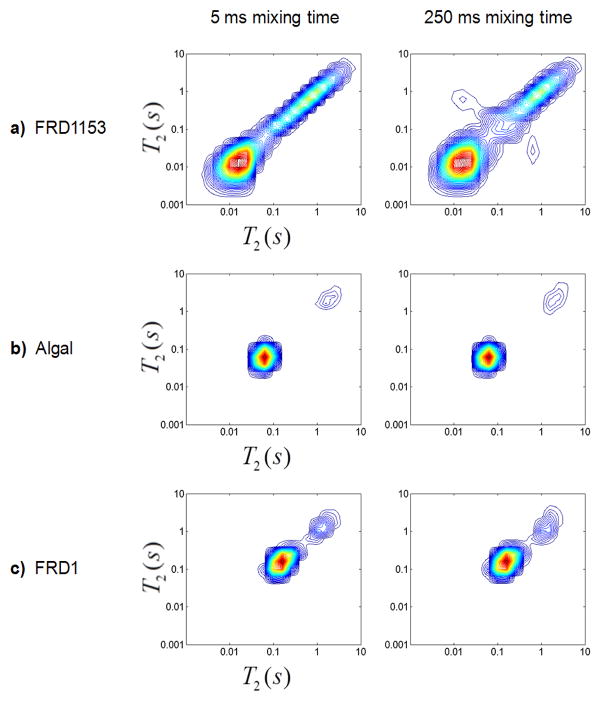
Figure 5.
T2-T2 correlations for mixing times of 5 ms (left column) and 250 ms (right column) for a) FRD1153, b) algal, and c) FRD1 gels after draining of bulk water and aging for 10 days. The plots are shown with 50 contour lines from 0 to the maximum intensity. 2D T2-T2 experiments were integrated in the vertical direction to obtain the 1D T2 profiles shown in Figure 7 and 8.

