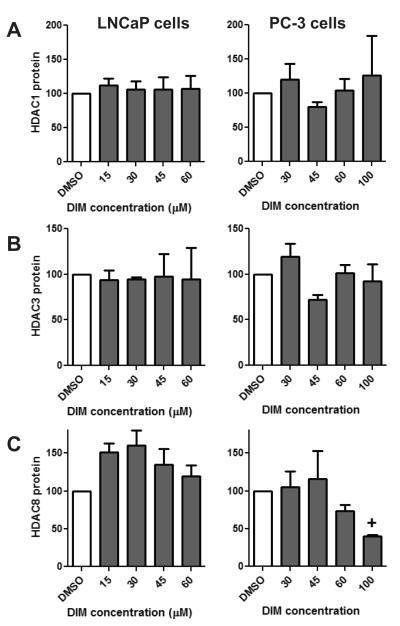
Fig. 5.
Effect of DIM on class I HDACs. LNCaP and PC-3 cells were treated with increasing concentrations of DIM or DMSO for 48 hours. Data are densitometry results of Western blots for A) HDAC1 B) HDAC3 and C) HDAC8 protein levels normalized to [g533]-actin and the DMSO control. Data are expressed as a percentage of the DMSO control treatment and represent an average of 3-7 independent experiments ± SEM. Statistical significance: + p=0.0582, compared to DMSO control samples.

