Figure 2.

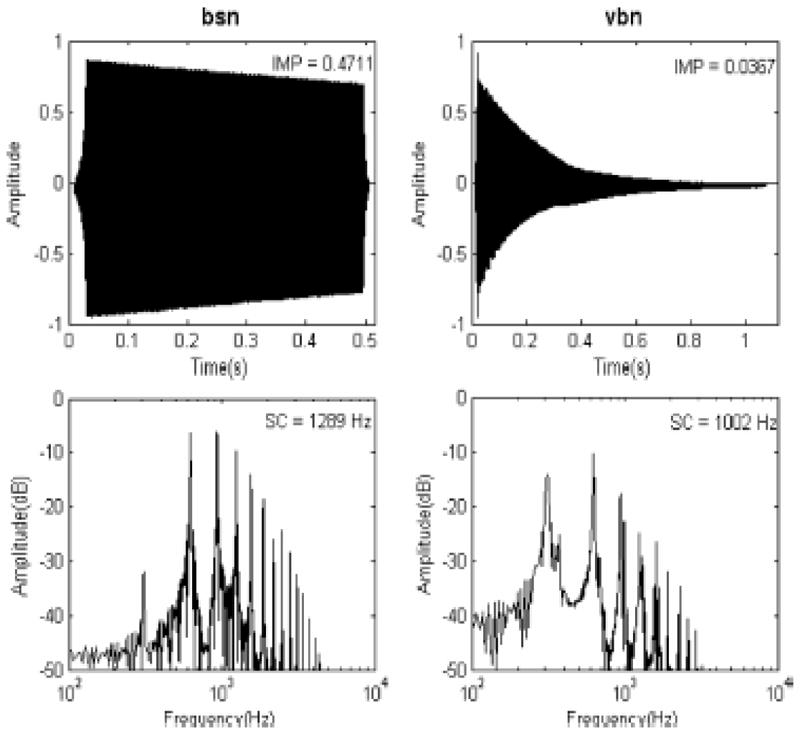
Time waveforms (top) and spectra (bottom) of two musical stimuli – bsn (left) and vbn (right). The impulsiveness (IMP) and spectral centroid (SC) values of each stimulus are shown in the upper right corner in each panel.

Time waveforms (top) and spectra (bottom) of two musical stimuli – bsn (left) and vbn (right). The impulsiveness (IMP) and spectral centroid (SC) values of each stimulus are shown in the upper right corner in each panel.