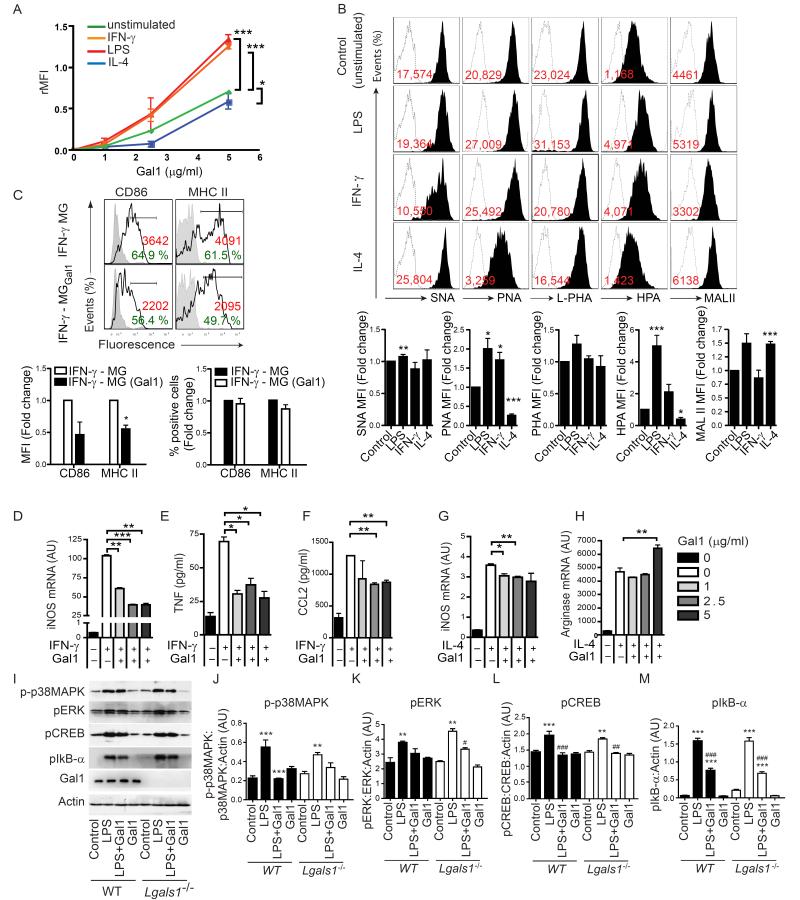
Figure 2. Gal1 Differentially Modulates Microglia Activation in vitro.
(A) Flow cytometry of resting and polarized microglia subsets incubated with increasing concentrations of recombinant Gal1. (B) Expression of cell surface glycans on M1 (LPS, IFN-γ), M2 (IL-4) and resting (unstimulated) microglia, detected with biotinylated SNA, PNA, L-PHA, HPA and MAL II (black filled histograms) or with FITC-conjugated streptavidin alone (dashed open histograms). Red numbers represent the relative median of intensity (median of intensity (Lectin) – median of intensity (Streptavidin control)). Bar diagrams display the lectin binding as fold change relative to unstimulated microglia. (C) Flow cytometry of M1 microglia activated by IFN-γ (24 h). Control (IFN-γ-MG) or Gal1-treated (IFN-γ-MGGal1) microglia were stained with antibodies against CD86 and MHC II. Black lines represent specific antibody binding whereas tinted lines represent unspecific fluorescence signal. Percentage of positive cells and relative median fluorescence (rMFI): (median fluorescence intensity of specific marker signal – median fluorescence intensity of unspecific signal) are shown. Bar diagrams display the relative MFI and percentage of positive cells as fold change relative to IFN-γ-treated microglia. (D-H) Effect of Gal1 on the expression of specific activation markers of IFN-γ- or IL-4-stimulated microglia as determined by quantitative RT-PCR for iNOS (D,G) and arginase (H) mRNA or by bead-based Luminex assay for TNF (E) and CCL2 (F). (I-M) Immunoblot blot (I) and densitometric analysis (J-M) of p-p38MAPK, pERK1/2, pCREB and pIκB-α in neonatal microglia obtained from Lgals1−/− or WT mice, pre-treated or not with Gal1 (5 μg/ml) and stimulated with LPS. Data are representative (B and C upper panel, I) or are the mean ± SEM (A-H, J-M) of three independent experiments. *P<0.05; **P<0.01; ***P<0.005 versus control. See also Figure S2 and S3.

