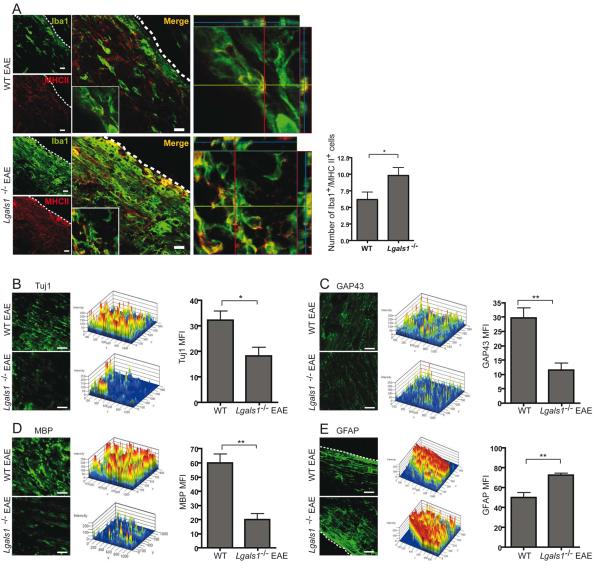
Figure 4. Endogenous Gal1 Controls Classical Microglia Activation in vivo and Limits EAE Neuropathology.
(A-E) Confocal microscopy of spinal cord white matter of WT and Lgals1−/− mice 35 days after immunization with MOG35-55. (A) Left. Spinal cord sections were stained for Iba1 (green) and MHC II (red). Insert shows low magnification micrograph of representative cells. Middle. 3D reconstruction ortho-view of low magnification migrograph. Right. Quantification of MHC II, Iba1 double positive microglia cells (n=20). (B) Left. Spinal cord sections were stained for Tuj1 (green). Middle. 2.5D intensity analysis of Tuj1 staining. Right. mean fluorescence intensity (MFI) of immunoreactivity against Tuj1. (C) Left. Spinal cord sections were stained for GAP43 (green). Middle. 2.5D intensity analysis of GAP43 staining. Right mean fluorescence intensity (MFI) of immunoreactivity against GAP43. (D) Left. Spinal cord sections were stained for MBP (green). Middle. 2.5D intensity analysis of MBP staining. Right mean fluorescence intensity (MFI) of immunoreactivity against MBP. (E) Left. Spinal cord sections were stained for GFAP (green). Middle. 2.5D intensity analysis of GFAP staining. Right mean fluorescence intensity (MFI) of immunoreactivity against GFAP. Scale bars= 20 μm. (A-E) Data are representative (images) or are the mean (bars) ± SEM of three independent experiments. *P < 0.05; **P < 0.01.

