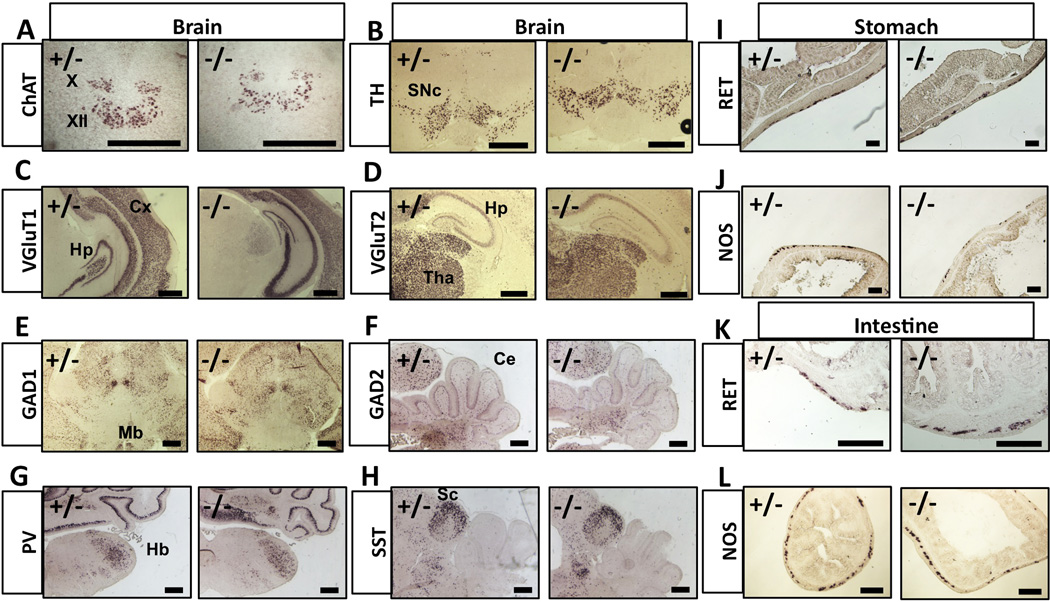
Figure 3. Neuronal differentiations are grossly normal in Tmeff2-KO mice.
A–H. Representative brain images of in situ hybridization results using probes against ChAT, TH, VGluT1, VGluT2, GAD1, GAD2, Parv or SST are shown here.
X, vagus nuclei; XII, hypoglossal nuclei; SNc, substantia nigra; Cx, cortex; Hp, hippocampus; Tha, thalamus; Mb, midbrain; Ce, cerebellum; Hb, hindbrain; Sc, superior colliculus.
I–J. Representative images of RET (I) or Nos1 (J) in situ hybridization results on sections of stomachs from control (+/−) and Tmeff2-KO (−/−) mice.
K–L. Representative images of RET (K) or Nos1 (L) in situ hybridization results on sections of intestines from control (+/−) and Tmeff2-KO (−/−) mice. Scale bars: 100µm.

