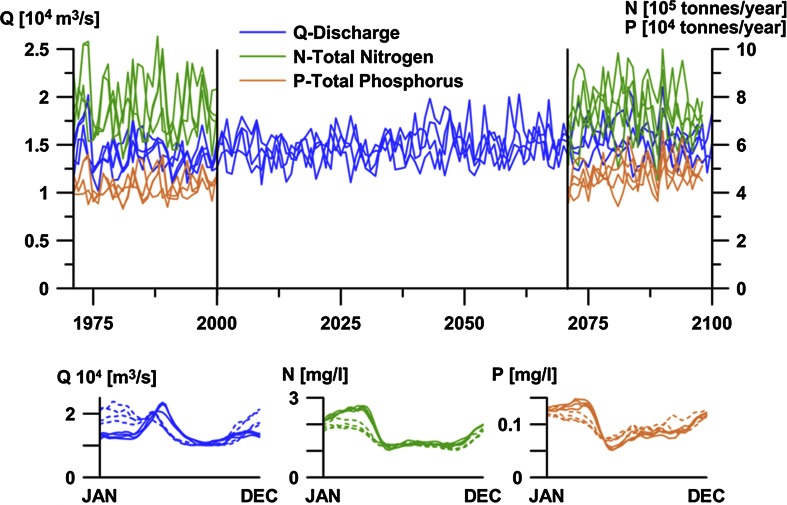
Fig. 4.
Simulated dynamics of annual water and nutrient loads, when experimenting with the four climate projections in the Balt-HYPE model. The time slices used in the estimation of future changes of average loads are marked in the upper graph. The lower graphs show dynamics in water flow and nutrient concentrations during an average year; solid lines for the period 1971–2000, dotted lines for the period 2071–2100. Each line represents one climate projection

