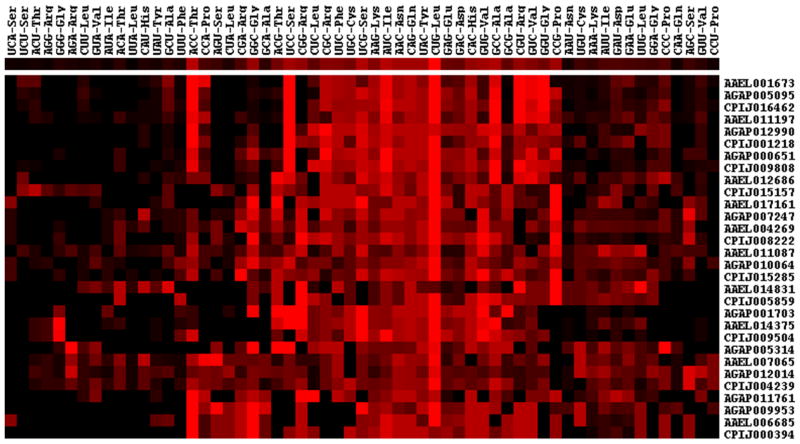
Figure 3.
Hierarchical clustering pattern of codon usages among 30 genes coding perfectly conserved proteins. The codons are listed in rows and genes are in columns. The clustering is based on rank order of relative synonymous codon usage (RSCU) of each codon in each gene. Red indicates preferred usage of a codon in the gene and black indicates rare usage of codon in the corresponding gene.

