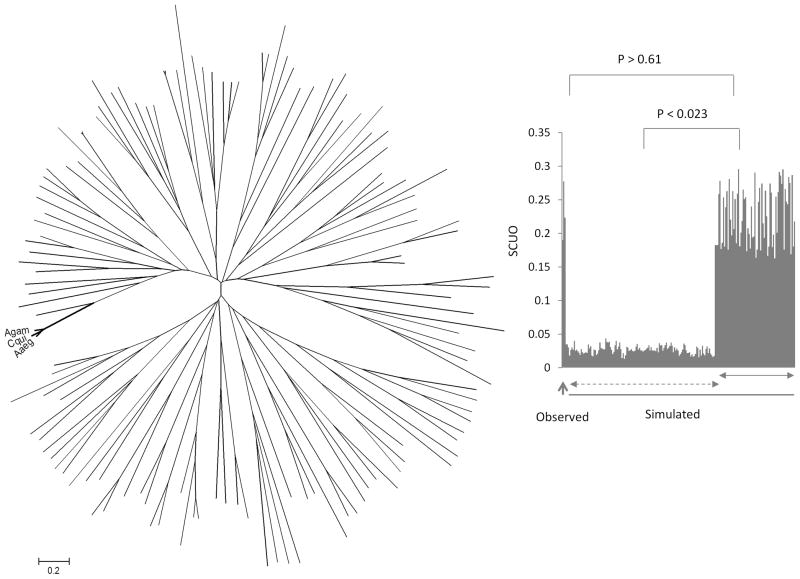
Figure 4.
Phylogenetic (Neighbor-joining) tree analysis of observed and simulated coding sequences of the genes. The observed genes are indicated by Agam, Cqui and Aaeg representing the three mosquitoes. All other sequences represent simulated coding genes generated by the EvolveAgene 3 program. The distance scale is shown at the bottom. On the right: Comparison of codon bias (SUCO values on the Y-axis) of observed (shown by an upward arrow) and the simulated sequences. The sequences shown by a solid horizontal arrow are the simulated coding sequences that represented amino acid sequences without any variation. The simulated sequences shown by a dashed horizontal arrow coded for proteins where variation in the amino acid sequences were found. The significance values of differences in codon bias are indicated above the graph.

