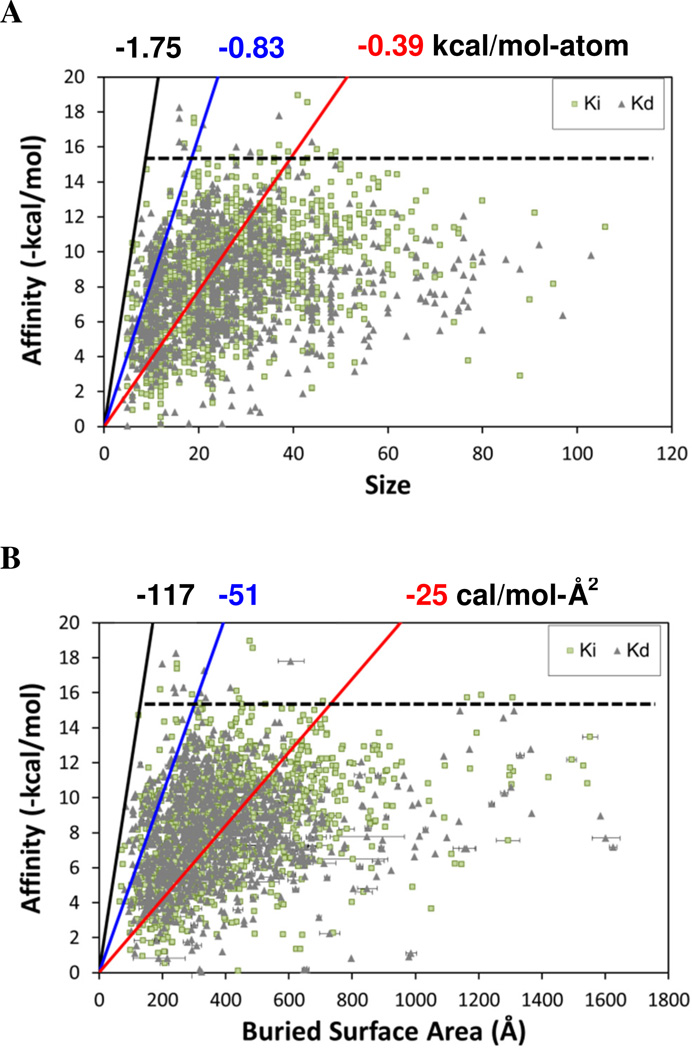
Figure 1.
Plotting the affinity of the complexes versus their physical characteristics reveals the limiting cases as well as the general trends. Measurements used for affinity data are noted as Ki (light green squares) or Kd (grey diamonds). (A) Affinity versus size of the ligand, where size is given as the number of non-hydrogen atoms. (B) Affinity versus the buried surface area of the binding site. The “hard limits” of ligand efficiency are denoted with black lines and values; the “soft limits” which bound 95% of the data are denoted with blue lines and values; the average ligand efficiencies are given with red lines and values. The horizontal dashed black line denotes how few of the complexes have affinities greater than 15 kcal/mol.

