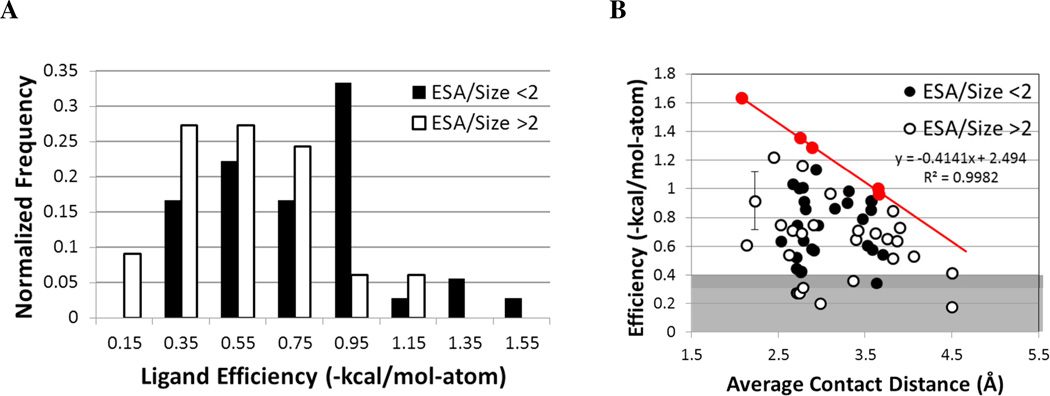
Figure 5.
Relationship between efficiency, exposure, and protein contacts for ligands with 5– 10 atoms and more than one charge site. (A) The distribution of efficiencies is compared for systems with well buried (black) versus more exposed sites (white); a cutoff of 2 Å2/atom is used to define the two sets. (B) Efficiencies are compared to the average contact distance between charged groups (black circles denote systems with ESA/size < 2 Å2/atom, and white circles are ESA/size > 2 Å2/atom). The line highlights the drop in maximal efficiency as the contacts become less favorable: roughly 0.41 kcal/mol-atom for every 1 Å increase in the average contact distance. The points used to set the line are colored red. The gray background notes systems with more modest efficiencies. The error bar indicates the standard deviation of the average of two affinity values reported in the literature 70,71.

