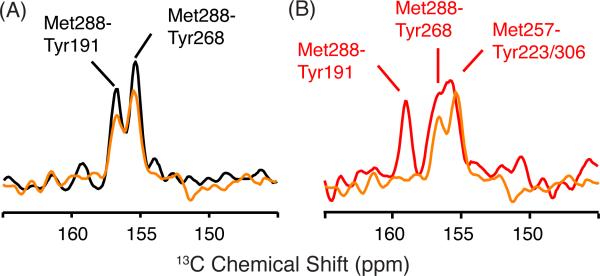
Figure 8.
Two-dimensional 2D DARR NMR spectra of 13Cζ tyrosine, 13Cε methionine-labeled rhodopsin. (A) Slices through the 13Cζ tyrosine diagonal resonance from 2D DARR NMR spectra of rhodopsin (black) and Meta I (orange) labeled with 13Cζ-tyrosine and 13Cε-methionine highlight the region of Tyr-Met cross-peaks. In rhodopsin, we observe cross-peaks between Met2887.35 -Tyr191EL2 and Met2887.35 -Tyr2686.51. Upon conversion to Meta I, the intensity of the cross-peaks does not change appreciably. (B) Slices through the 13Cζ-tyrosine diagonal resonance from 2D DARR NMR spectra of rhodopsin (black) and Meta II (red) are shown using the same labeling strategy as in (A).

